
There is a specific kind of silence that falls over a growth meeting when somebody asks a simple question and nobody can answer it.
The question is usually some version of: “How many of these people are real?”
Not “how many converted.” Not “what was the cost per acquisition.” Just: how many of the sessions, clicks, form fills, add to carts and free trial signups in this report came from a human being with a wallet, a preference, and the capacity to become a customer.
For most teams in 2026, the honest answer is that nobody knows. The dashboard reports a number. The number is precise to two decimal places. It is also, in the strict sense, unverified. It counts requests, not people. And the gap between those two things has grown from a rounding error into the single largest source of measurement error in digital marketing.
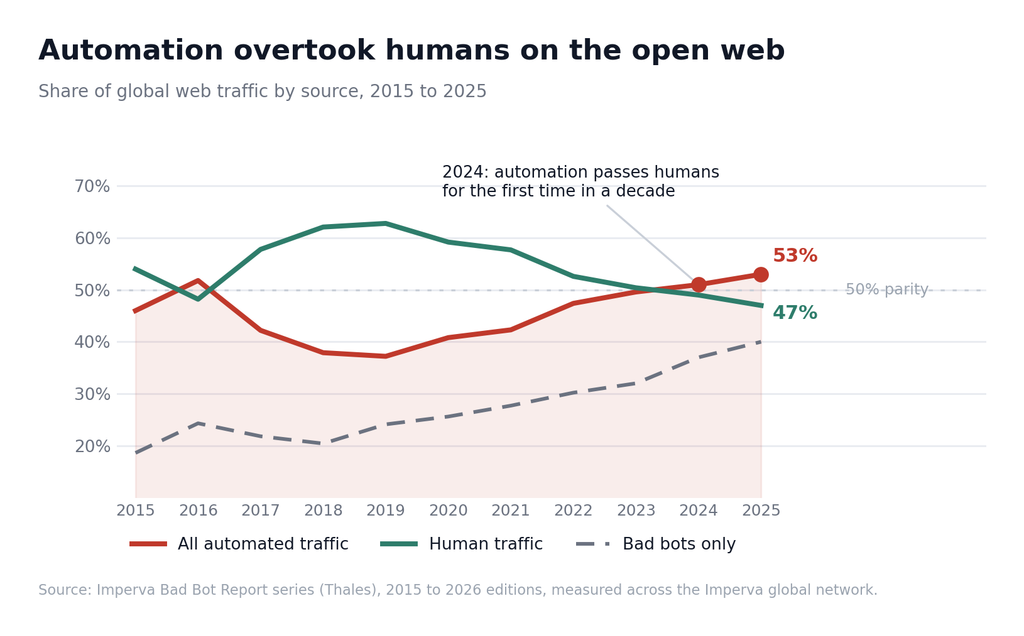
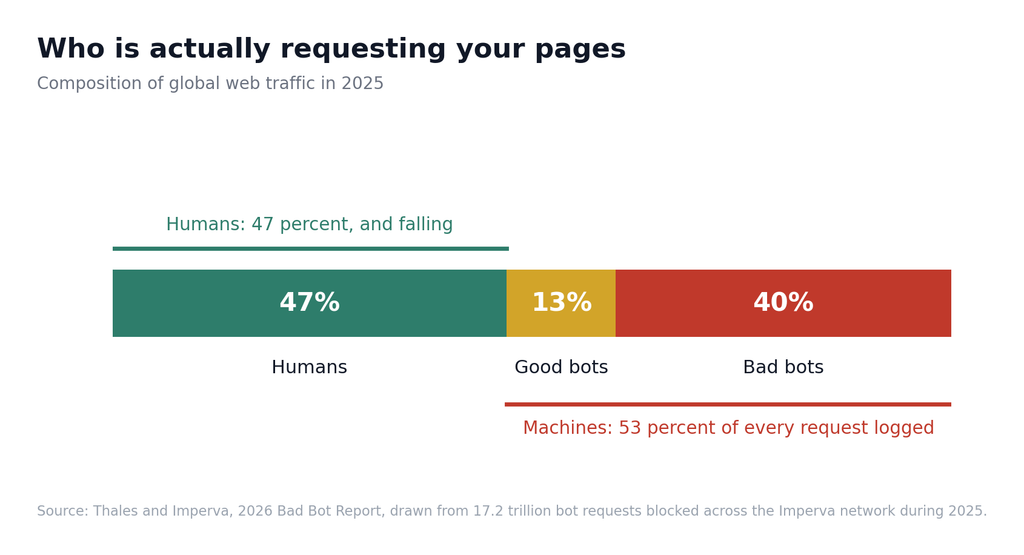
This is not hypothetical. In 2024, automated traffic crossed a threshold the industry had been watching for a decade: machines began generating more web traffic than people. Automated traffic surpassed human activity for the first time in a decade, reaching 51% of all web traffic, according to the twelfth annual Imperva Bad Bot Report published by Thales. One year later the line moved again. The 2026 edition found that automated traffic accounted for more than 53% of all web traffic in 2025, while human activity fell to 47% and continues to decline.
Sit with that. If you run a website today, the median request hitting your origin is not a person. Your analytics platform was designed in a world where that assumption was inverted, and it has never fully caught up.
This guide is about closing the gap. It is long because the problem is layered, and because the shallow version of this advice, “turn on bot filtering in GA4 and move on,” is worse than useless. It creates confidence without accuracy. What follows is the full picture: what the pollution is made of, where it enters your stack, what it does to each metric on the way through, how to detect it with evidence rather than guesswork, how to rebuild a metric set that survives contact with reality, and how to prove the new numbers are right using methods that have held up in peer reviewed economics literature for over a decade.
We build ClickBaton precisely because we could not find an honest answer to that meeting room question for our own projects. Everything here reflects what we learned building it, cross checked against published research from Cloudflare, Thales and Imperva, HUMAN Security, DataDome, Fastly, the Media Rating Council, the Association of National Advertisers, and the academic literature on advertising causality. Every material claim is linked to its source.
The Night the Dashboard Lied
Let us start with a story that will feel familiar, because a version of it has happened to nearly every performance team we have spoken to.
A software company runs a paid campaign into a landing page. The campaign performs. Sessions climb 40 percent month over month. Form fills climb with them. The conversion rate holds steady at a respectable 2.1 percent. In the weekly report this looks like a clean win, and the natural response is the one every playbook recommends: scale the winner. Budget doubles.
Six weeks later the pipeline review tells a different story. Sales development has burned two hundred hours on leads that never answered. Email bounce rates on the new cohort run four times higher than the house list. The demo show rate has collapsed. Revenue has not moved. The line that looked like the best performing item in the account has produced almost nothing except activity.
Nobody lied. Every number in that dashboard was computed correctly from the data it was given. The failure was upstream of the arithmetic. The system counted events faithfully and had no idea whether the entities generating those events were people.
This is the shape of the problem. Traffic pollution rarely announces itself as a spike of obvious garbage. Obvious garbage is easy. A crude scraper hammering your sitemap from a single datacentre address gets caught by a five year old rule. The pollution that actually damages decisions is the pollution that behaves plausibly: it arrives through a residential address in your target market, presents a current Chrome user agent, executes your JavaScript, scrolls, waits, fills the form with a real looking name and a functioning inbox, and then never converts to anything downstream.
By the time you discover it, that traffic has done three separate kinds of damage. It has consumed budget. It has corrupted the historical baseline you compare future performance against. And, most expensively, it has taught your bidding algorithms what a good customer looks like using examples that were never customers at all.
Bad data does not sit still. It compounds.
The Internet Stopped Being Mostly Human
The single most important context for everything that follows is that this is a structural change, not a bad quarter.
The Imperva Bad Bot Report has tracked automated traffic across a global network since 2013, which makes it the longest running public series on the subject. The 2026 edition, covering full year 2025, is built on the detection and blocking of 17.2 trillion bot requests. It splits the web into three parts: good bots at 13%, bad bots at 40%, and humans at 47%. That 40% figure for malicious automation is a three point jump from 37% the year before, and the seventh consecutive annual increase.
Different vantage points produce different numbers, and understanding why matters more than picking a favourite statistic.
Cloudflare measures across an anycast network carrying enormous volumes of cached human traffic, so its ratios look gentler. In the 2025 Radar Year in Review, Cloudflare isolated requests for HTML content and found that traffic from AI bots averaged 4.2% of HTML requests, while Googlebot alone originated 4.5%, a share slightly larger than every other AI bot combined. Non AI bots, meanwhile, generated roughly half of all HTML page requests during 2025, running about 7 percentage points above human traffic and reaching 25 percent higher at points in the year.
Fastly, looking at its own edge, put automated bot traffic at 37% of observed activity across its global network in a single quarter.
These are not contradictions. They are measurements of different populations, and the correct response is to stop asking what the industry average is and start measuring your own site. Imperva’s figure skews toward enterprise properties that attackers actively target. Cloudflare’s skews toward the full breadth of the web including static assets. Your traffic mix, vertical, geography and price point will place you somewhere on that spectrum, and the only way to know where is to instrument for it.
What every dataset agrees on is direction. HUMAN Security processed more than one quadrillion interactions across its global customer base in 2025 and found that automated traffic grew eight times faster than human traffic year over year. Broken into components, automated traffic grew 23.51% while human traffic increased 3.10% over the same period.
That ratio is the whole story in one line. Human demand is growing at roughly the rate of the economy. Machine demand is growing at roughly the rate of AI adoption. Any metric with sessions, users, clicks or impressions in the denominator is being diluted a little more every month, and the dilution is accelerating.
There is a second order effect worth naming early. When the denominator inflates and the numerator does not, ratios fall. Teams read falling conversion rates as a landing page problem, a creative problem, a pricing problem. They run tests. The tests come back inconclusive because the noise floor has risen. Months disappear into optimising a funnel that was never broken, while the actual cause sits in the traffic composition nobody is measuring.
What Polluted Traffic Actually Means
The phrase “bot traffic” is doing too much work, and that is one reason teams get this wrong. It bundles together categories with completely different implications for measurement, cost and strategy.
A better frame is pollution: any recorded event that a reasonable analyst would exclude if they knew its true origin. That definition is deliberately outcome oriented. It does not ask whether the traffic was malicious. It asks whether counting it produces a wrong decision.
Under that definition, pollution comes in four families.
Declared automation. Crawlers and agents that identify themselves honestly. Googlebot, Bingbot, uptime monitors, link previewers, accessibility scanners, SEO tools, AI training crawlers that publish their address ranges. This traffic is not hostile. It is often desirable. But it is not a customer, and every one of its page views that lands in your session count makes your engagement rate, your bounce rate and your conversion rate wrong.
Undeclared automation. Scripts and headless browsers that present themselves as consumer browsers. Scrapers harvesting your pricing, competitors monitoring your inventory, aggregators building comparison tables, AI systems fetching content without declaring purpose. This traffic is designed to be indistinguishable from human traffic at the surface level, and it usually succeeds against list based defences.
Adversarial automation. Credential stuffing, carding, inventory hoarding, click fraud, form spam, affiliate fraud, fake account creation. This traffic is actively hostile and actively evasive. It is also the family most likely to interact with your conversion points, because conversion points are where the money is.
Human but invalid. Click farms, incentivised traffic, competitors manually exhausting your budget, employees and contractors, agency quality assurance, and the whole category of visitors who arrived through a misleading placement with no intent from the first millisecond. Every one of these is a real person. None is a real customer. Detection built purely around “is this a bot” misses this family completely, which is exactly why the framing matters.
Only one of those four families is unambiguously an attack. The other three are ordinary structural features of how the modern web works, and they will still ruin your numbers. This is why “we have a web application firewall” is not an answer to a measurement question. Blocking and measuring are different jobs. You want to block the third family. You want to permit much of the first and second. You want to measure all four separately, always, and exclude every one of them from the metrics you use to allocate budget.
The Vocabulary You Need: GIVT, SIVT and Everything Between
Before going further it is worth borrowing the industry’s own taxonomy, because it is precise, widely adopted, and it gives you shared language for arguments with vendors and platforms.
The Media Rating Council publishes the Invalid Traffic Detection and Filtration Guidelines, which every accredited measurement vendor is assessed against. The MRC deliberately avoids the word fraud, because fraud implies intent and most invalid traffic has none. Instead it defines invalid traffic as activity that does not meet quality or completeness criteria, or otherwise does not represent legitimate traffic that should be included in measurement counts. It then splits that into two tiers.
General Invalid Traffic, or GIVT, covers activity identified through routine, list based means of filtration: declared bots, spiders and crawlers, non browser user agent headers, and prefetch or browser prerendered traffic. GIVT is the easy tier. If a thing announces itself and appears on a maintained list, it is GIVT.
Sophisticated Invalid Traffic, or SIVT, covers the harder cases that require advanced analytics, multipoint corroboration and significant human intervention to identify: hijacked devices, hijacked ad tags or creative, adware, malware, misappropriated content, and in 2026 you can add residential proxy networks, human mimicking automation and autonomous agents to that list. The distinction has practical teeth: MRC accreditation for SIVT includes GIVT, but not the other way round, and most inexpensive filtering products only address GIVT.
Here is the part that matters for your reporting.
GIVT is a hygiene problem. SIVT is a truth problem. Removing GIVT makes your numbers tidier. Removing SIVT changes what your numbers mean. Any vendor, platform or internal process that only handles the first tier is providing sanitation, not verification, and you should price its assurances accordingly.
There is a third concept the MRC guidelines introduced that almost nobody talks about but that we think is the most useful single idea in the whole standard: the decision rate. It is the proportion of traffic a detection service actually reached a determination on, as opposed to passing through undecided. A filter that examines 40 percent of your traffic and clears all of it is not telling you your traffic is clean. It is telling you it looked at 40 percent. When you evaluate any traffic quality product, including ours, the coverage question comes before the accuracy question. Ask what fraction of requests received a verdict, and what happens to the remainder.
A Field Guide to the Things That Are Not Your Customer
Abstraction is comfortable. Specifics are useful. Here is the catalogue of non human and non valuable traffic that shows up in real logs, roughly ordered by how often we see it cause a measurable reporting error.
Search engine crawlers. The oldest category and the best behaved. Googlebot is also, by volume, the largest single crawler on the web. In 2025 it accounted for over 28% of traffic from verified bots on Cloudflare’s network, with OpenAI’s GPTBot and Microsoft’s Bingbot following at 7.5% and 6%. Well configured analytics usually excludes these, but “usually” is carrying weight in that sentence.
AI training crawlers. Systems fetching content in bulk to build model corpora. They generally declare themselves, they generally respect robots directives, and they send back essentially nothing. Cloudflare’s analysis in mid 2026 found that training purposes made up around half of AI bot traffic on its network while search bots, the ones that historically paid for access with clicks, were down to 10.7%.
AI fetchers and retrieval agents. These pull a page in real time because a user asked a question. Fastly found that fetcher request volume has exceeded 39,000 requests per minute in some cases, enough to mimic the effect of a denial of service attack without any malicious intent behind it. These fetches correlate with genuine human interest, which makes them analytically interesting and operationally expensive at the same time.
Agentic browsers. A browser driven by a model on behalf of a named user. This is the fastest growing category on the web by a wide margin: HUMAN Security measured traffic from AI agents and agentic browsers growing 7,851% year over year. Some of these sessions end in a real purchase by a real person. Your analytics has no idea what to do with them.
Uptime and performance monitors. Pingdom, UptimeRobot, synthetic checks from your own observability stack, Lighthouse runs in continuous integration. Small volume, high frequency, disproportionate impact on averages because they are perfectly regular and always bounce.
Link preview unfurlers. Every time somebody pastes your URL into Slack, WhatsApp, iMessage, LinkedIn or a mail client, something fetches the page to build a card. Share heavy content can generate thousands of these. They look like direct traffic with a zero second session.
Security and brand protection scanners. Vulnerability scanners, phishing detection services, certificate transparency monitors, brand safety crawlers. Some are yours. Most are not.
SEO and competitive intelligence crawlers. Ahrefs, Semrush, Majestic, Screaming Frog runs, and the long tail of tools your competitors point at you. Frequently the largest source of non search crawler load on a content site.
Price and inventory scrapers. In retail, travel and marketplaces this is often the single largest category by request volume. Imperva found 48% of all web traffic to travel sites was bad bots in 2024, against 47% human and 5% good bot. In that vertical, humans are a minority of your audience.
Credential stuffing and account takeover automation. Aimed at your login, not your landing page, but it distorts user counts, session counts and any funnel that begins with authentication. Financial services absorbed 22% of all account takeover incidents, the highest of any sector.
Click fraud and budget exhaustion bots. Automation whose purpose is to consume your paid clicks. Sometimes run by fraudulent publishers earning a share of the spend, sometimes by competitors, occasionally by an affiliate gaming attribution.
Form spam and lead generation fraud. Bots that complete your conversion action. The most damaging category per unit of volume, because it does not merely dilute the denominator, it corrupts the numerator.
Human click farms. Real people, paid per action, usually routed through residential proxies in your target country so that geography checks pass. No automation signal will catch them. Only outcome data will.
Internal traffic. Your own team, your agency, your developers, your QA scripts, the staging environment somebody pointed at production analytics. Boring, ubiquitous, and routinely responsible for several percent of recorded conversions on smaller sites.
Prefetch and prerender. Browsers and platforms speculatively loading pages the user has not yet chosen to visit. Explicitly named in the MRC guidelines as GIVT, and almost never excluded correctly in practice.
Fourteen categories. Two of them are hostile. All fourteen belong in a measurement exclusion list, and no two require the same detection technique.
Why Google Analytics Cannot Save You
Almost every conversation we have about this reaches the same objection within the first five minutes: “Doesn’t GA4 already filter bots?”
It does. Partially. And the shape of that partiality is the single most important thing to understand about your current numbers.
Google’s own documentation is admirably direct about it. In the known bot traffic exclusion help article, Google states that traffic from known bots and spiders is automatically excluded, that known bot and spider traffic is identified using a combination of Google research and the International Spiders and Bots List maintained by the Interactive Advertising Bureau, and, critically, that you cannot disable known bot traffic exclusion or see how much known bot traffic was excluded.
Read that last clause again, because it has three consequences that most teams never think through.
First, the filter is list based. The IAB and ABC International Spiders and Bots List is a curated register of declared automation. In MRC terms it addresses GIVT. It does not attempt to catch SIVT, and it makes no claim to. A headless Chrome instance presenting a stock user agent through a residential address is not on that list and never will be, because there is nothing to list. The list identifies self declaring agents. Anything that does not declare itself is, by construction, out of scope.
Second, you cannot audit it. Because the exclusion is invisible, you cannot compute what fraction of raw hits it removed, you cannot compare that fraction across months, and you cannot tell whether a sudden drop in sessions came from a genuine demand change or a list update. Your baseline moves silently. This is not a criticism of Google so much as an observation about what a black box costs you: an invisible filter is not a measurement, it is an assumption.
Third, list updates lag reality. New crawlers, new agent user strings and new automation frameworks appear continuously. The list catches up. In the interval, the traffic is counted as human.
There is a further problem that predates AI entirely. Google Analytics accepts events through the Measurement Protocol, which means anything that knows your measurement identifier can write into your property without ever touching your website. This is the mechanism behind referral spam and what practitioners call ghost traffic: fabricated sessions that inflate your counts and pollute your referral reports without a single request ever reaching your server. Independent analysis has repeatedly noted that GA4 filters the bots it already knows about and counts the rest as real visitors, which makes the reported bot share in GA4 a structural undercount rather than a measurement.
And there is a timing constraint. GA4 data filters apply going forward from activation. They do not clean history. If you turn something on today, your year over year comparison is now comparing a filtered period against an unfiltered one, and any improvement you see may be entirely an artefact of the filter.
None of this makes GA4 a bad product. It is an excellent behavioural analytics tool and we use it. But it was designed to answer “what did users do on my site,” and it takes the definition of user as an input rather than producing it as an output. The question of who is real has to be answered before the analytics platform receives the event, not after. That single sentence is the design principle behind everything in the second half of this guide.
The same critique applies, with local variations, to every client side analytics product on the market. If your measurement depends on a JavaScript tag executing in something that claims to be a browser, then anything that can execute JavaScript and claim to be a browser can write to your dataset. Modern headless automation does both trivially.
Where Pollution Enters Your Stack
To fix a leak you need to know where the water is coming in. Pollution enters at seven distinct points, and each one requires a different control.
The ad auction. Before a human is involved at all, invalid inventory is bought. This is where made for advertising sites, spoofed domains and fraudulent supply paths live. The Association of National Advertisers has been quantifying the scale for three years. Its first study in 2023 found that made for advertising publishers commanded 15% of programmatic ad spend and 21% of impressions, and that the average campaign ran across 44,000 websites when a few hundred would have reached the majority of the audience.
The click. A click is recorded that no person made, or that a person made without intent. This is the layer most people mean by click fraud, and it is where paid channels bleed most visibly.
The landing. A request arrives at your page. Whether that request executes JavaScript, renders, and looks like a browser determines whether it enters your analytics as a session. Scrapers, agents and headless automation all land here.
The engagement. Scroll depth, time on page, video plays and interaction events are generated. Sophisticated automation now simulates all of these, and it does so specifically because engagement signals are what modern detection and bidding systems look at.
The conversion. A form is submitted, a trial is started, an account is created, an item is added to a cart. This is the most expensive entry point because the event is not just counted, it is transmitted to advertising platforms as a training signal.
The identity join. The lead enters your CRM, gets a record, gets an owner, gets a sequence. A fake record here has a long half life and contaminates every downstream report, including the ones finance uses.
The reporting join. Data from platforms, analytics, the warehouse and the CRM is stitched into a dashboard. Every mismatch in definition between those sources creates room for the pollution to be double counted, or hidden, or blamed on the wrong channel.
The reason we lay this out as seven distinct points rather than one is that teams routinely install a control at one layer and assume the whole chain is covered. A pre bid fraud filter does nothing about form spam. A CAPTCHA on your form does nothing about the fact that you paid for the click. Server side tagging does not detect anything on its own, it only changes where collection happens. Each layer needs its own control and its own measurement, and the controls need to share a common session identifier or you will never be able to reconcile them.
The Arithmetic of a Polluted Funnel
Numbers make this concrete in a way that argument cannot. Let us walk a single month through a funnel twice, once as the dashboard reports it and once as verification finds it.
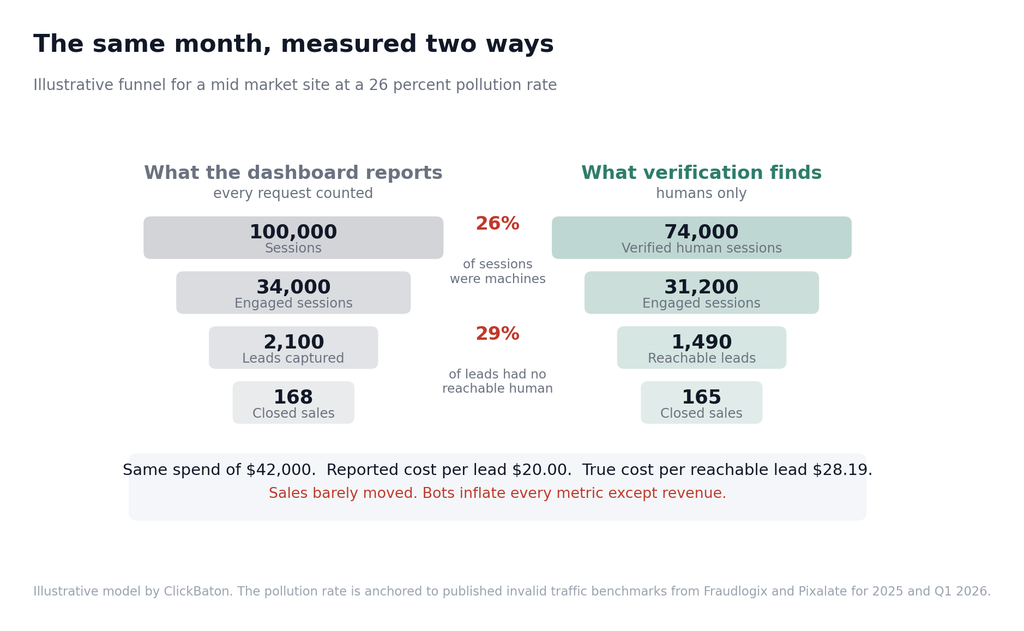
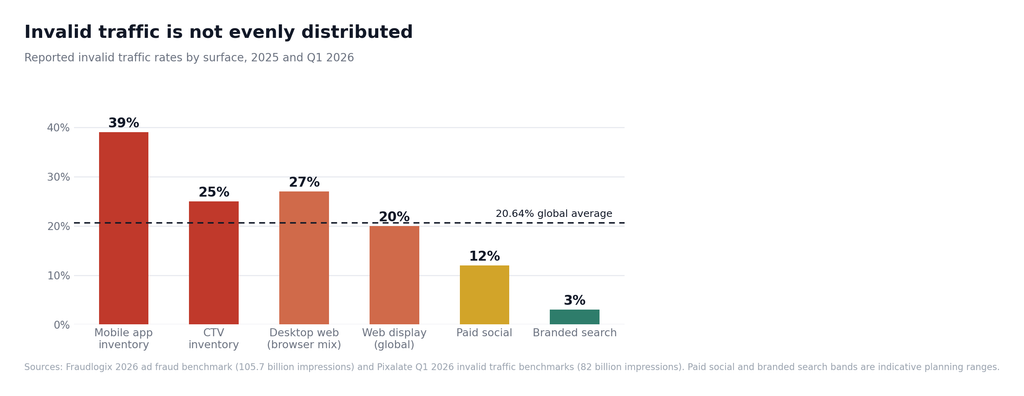
The pollution rate we use is 26 percent. That is not a worst case. Fraudlogix analysed 105.7 billion impressions across 2025 and found a global invalid traffic rate of 20.64%, and in the United States specifically 20.37% in the first quarter of 2026, improved from 23.69% the year before. Pixalate, working across 82 billion programmatic impressions in Q1 2026, reported 20% invalid traffic on web, 39% on mobile app and 25% on connected television. A mixed channel site sitting slightly above the web average is an ordinary case, not an extreme one.
Here is the month.
As reported: 100,000 sessions. 34,000 engaged sessions. 2,100 leads captured. 168 closed sales. Media spend of $42,000. That produces a 2.10 percent lead conversion rate and a cost per lead of $20.00. Sales conversion from lead runs at 8 percent. Everything looks defensible.
As verified: 74,000 of those sessions came from something that passed human verification. Engagement holds up better than raw sessions, at 31,200, because much automation does not linger. Of the 2,100 leads, 1,490 belonged to a reachable human. Closed sales: 165, because the three lost sales were duplicates and internal test submissions rather than fraud.
Now recompute. True cost per reachable lead is $28.19, not $20.00, a 41 percent increase. True conversion from verified session to reachable lead is 2.01 percent, almost identical to the reported figure. And true sales conversion from a reachable lead is 11.1 percent, materially better than the 8 percent the dashboard showed.
Three lessons fall directly out of that arithmetic, and they are worth stating plainly because they are counterintuitive.
One: the conversion rate barely moved. Because pollution inflates both the numerator and the denominator, ratio metrics can look stable while everything underneath them rots. This is why conversion rate is a terrible early warning indicator for traffic quality. It is one of the last numbers to break.
Two: the cost metrics moved enormously. Any metric with a currency amount over a count is exposed to the full pollution rate, because the spend is real even when the event is not. Cost per lead, cost per acquisition and return on ad spend are where pollution actually shows up.
Three: your team’s real performance was better than reported. Sales was converting reachable leads at 11.1 percent while being measured at 8 percent. That is a meaningful difference in a compensation conversation, and it is the reason this work tends to have unexpected internal allies once the numbers are on the table.
Now extend the model. Suppose that of the 610 unreachable leads, 380 were bot submissions that were transmitted to your advertising platforms as conversion events. The platform’s optimisation now has 380 examples of what a valuable user looks like, and every one of them is wrong. It will look for more traffic resembling those examples. You have not merely wasted money, you have paid to make the next month worse. We return to this in detail shortly because it is, in our view, the most underrated cost of the entire problem.
The Metrics That Lie First
Different metrics degrade differently under pollution. Knowing the order of failure lets you build an early warning system instead of discovering the problem two quarters late.
Sessions and users degrade first and most. They are pure counts of arrivals with no quality gate at all. Any automation that renders a page adds to both. If you only track one diagnostic, track the ratio of sessions to verified human sessions and watch it weekly.
Bounce rate and engagement rate degrade second, and in a confusing direction. Crude automation produces single hit sessions, pushing bounce rate up. Sophisticated automation simulates scroll and dwell, pushing engagement rate up. A site with both kinds of pollution can show a perfectly normal blended engagement rate composed of two abnormal populations. This is why segment level analysis beats site level analysis every time.
Average session duration becomes noise. Automation either exits instantly or holds a page open for a fixed interval. Both distort a mean. If your session duration distribution has suspicious spikes at round numbers, you are looking at scripts, not people.
Geographic and device reports go wrong quietly. Residential proxy networks let operators present as any country. GreyNoise research covering four billion malicious sessions found that 39% came from residential addresses and 78% of those sessions evaded conventional address reputation feeds entirely. Meanwhile Fraudlogix data shows invalid traffic concentrating heavily by browser and device: Internet Explorer at 79.5% and Edge at 41.2%, with desktop at 27.03% against mobile at 19.30%, because bot operators favour legacy browser strings and datacentre infrastructure skews desktop.
Conversion rate degrades late, as shown above. Treat it as a confirmation metric, never a detection metric.
Cost per acquisition and return on ad spend degrade decisively. These are the numbers that hurt, and they are the numbers that will eventually force the conversation.
Attribution reports degrade unpredictably. Because pollution is not evenly distributed across channels, it silently reallocates credit. A channel with 4 percent invalid traffic will look worse than a channel with 30 percent invalid traffic in any model that counts conversions without verifying them. Pollution does not just make your numbers wrong, it makes them wrong in favour of your worst channels. That is the mechanism by which measurement error becomes budget misallocation.
Lifetime value and cohort curves degrade last and worst. A cohort containing 25 percent fake accounts will show a retention cliff at week one that looks like a product problem. Teams reshape onboarding in response. The onboarding was fine. The cohort was contaminated at the door.
Signal Pollution: How Bad Data Trains the Machine Against You
Ten years ago, a fake conversion cost you the price of the click. Today it costs you the price of the click plus the compounding cost of a corrupted training signal, and the second number is usually larger.
The reason is that every major advertising platform has moved to automated bidding driven by conversion signals you send back. Smart Bidding, Advantage Plus, Performance Max and their equivalents work by building a model of what a converting user looks like and then buying more traffic that resembles that model. The system is only as good as the examples you feed it. When you report a bot as a conversion, you are not making a reporting error. You are issuing an instruction.
Consider the mechanics on a small lead generation account. One practitioner analysis puts it well: a B2B advertiser generating 60 leads a week, 12 of them fake, is not losing 20 percent of budget, it is actively teaching the system to find the wrong 20 percent more often. Lead campaigns feel this hardest because the volumes are small and each event carries disproportionate training weight.
The feedback loop runs in four steps, and each turn of the loop makes the next one worse.
Step one. Invalid traffic reaches your site through a placement, a keyword, an audience or a supply path.
Step two. Some fraction of it triggers your conversion event. Form spam, fake trials, bot initiated add to carts.
Step three. That event is transmitted back to the platform as a positive label with its full context: the placement, the device, the geography, the time of day, the audience signal.
Step four. The optimisation model updates. It now believes that context produces value. It bids more aggressively into the same context. More invalid traffic arrives. Return to step two.
Three properties of this loop make it particularly nasty.
It is self reinforcing rather than self correcting. Ordinary optimisation errors get punished by falling performance, which pushes the system back toward truth. This one is rewarded, because the polluted context keeps producing the events the model was told to value.
It hides inside good news. The account metrics improve during the loop. Conversion volume rises, cost per conversion falls, the platform reports increasing efficiency. Everything on the surface says the campaign is learning. The correction only arrives when someone compares reported conversions against revenue, which is usually a different team on a different cadence.
It survives your cleanup. Suppose you install form protection and stop the bot submissions today. The model retains the learned preference for weeks. You have to actively retrain it by sending corrected signals, which means either uploading offline conversion adjustments or switching the optimisation target to a downstream event that fraud cannot reach.
That last point is the practical remedy, and it is the single highest leverage change most advertisers can make. Move the optimisation target as far down the funnel as your volume allows. Optimising to a form submission is optimising to something a script can do. Optimising to a qualified opportunity, a verified phone conversation, a shipped order or a second month of retention is optimising to something a script cannot do without an enormous amount of effort and a real payment instrument.
There is a volume trade off and it is real. Downstream events are rarer, so the model has fewer examples and learning is slower. Our rule of thumb: if a downstream event fires at least fifteen times a week per campaign, optimise to it. Below that, optimise to a verified upstream event with a value weight rather than the raw event. A verified lead reported with a value that reflects its historical close rate gives the model both frequency and truth.
One more note that catches people out. If you use enhanced conversions or any server side conversion pipeline, verification has to happen before transmission, not after. A cleaned dashboard with a polluted conversion feed is the worst of both configurations: you have accurate reporting and inaccurate optimisation, so you get to watch the machine misallocate your budget with perfect clarity.
AI Crawlers Are a Third Category, Not a Subcategory
The good bot versus bad bot binary broke in 2024 and it has not been repaired. AI systems fetching your content do not fit either bucket, and forcing them into one produces bad decisions in both directions.
They are not bad bots. Most declare themselves honestly, publish address ranges, respect robots directives and increasingly sign their requests cryptographically. They are not attacking you.
They are not good bots either, at least not in the sense that Googlebot was good. The original bargain of the crawlable web was reciprocal: you let the crawler take your content, and the search engine sent you visitors. That exchange funded two decades of publishing. AI crawlers take the content and mostly do not send visitors, because the answer is delivered inside the assistant.
The volume is not marginal. DataDome, drawing on five trillion signals analysed daily across more than 400 enterprises, processed 17.7 billion AI agent requests in the second quarter of 2026, up 45 percent from 12.2 billion in the first quarter. The monthly curve steepened rather than flattened: April at 4.77 billion, May at 6.29 billion, June at 6.60 billion. Fastly, measuring separately, found AI crawlers made up almost 80% of all AI bot traffic with Meta generating more than half of it, eclipsing Google and OpenAI combined.
The composition of that traffic has also shifted in a way that matters for anyone thinking about visibility. Cloudflare’s breakdown showed that search purpose crawling, the kind that can produce a citation with a link, made up under 10% of AI crawler requests in May 2026, with the remaining 90 percent going to training and answer generation where the model responds in place and the user never leaves the chat window.
For measurement purposes, AI traffic needs its own classification with at least four intents, because the correct handling differs for each.
Training crawlers build model corpora. They send no referrals. They consume bandwidth. Whether to allow them is a licensing and brand strategy decision, not a security one, and it belongs with legal and executive rather than with the security team alone.
Search and indexing crawlers build retrieval indexes that can cite you. These are the closest analogue to classic search crawlers and blocking them is usually self harm.
Retrieval fetchers pull a specific page because a user asked a question right now. These correlate with live human intent and are arguably the most valuable AI traffic on your site, even though they generate no session.
Agentic browsers act on behalf of a named person and may complete transactions. These are prospective customers wearing an unfamiliar shape.
A single robots directive that blocks “AI bots” collapses four separate business questions into one answer, and the answer is usually wrong. This is why the ClickBaton agent registry classifies by declared function and inferred intent rather than by operator, and why our crawler verification runs a ladder of checks rather than trusting a user agent string.
That verification matters more than it used to, because impersonation has become routine. DataDome found that known agents are actively used as cover, with Meta ExternalAgent the most impersonated at 16.4 million spoofed requests, followed by ChatGPT User at 7.9 million, and PerplexityBot showing the highest impersonation rate at nearly 2.4% of requests. If you are allowlisting by user agent string, you are allowlisting attackers.
The platform layer is moving to close this. Cloudflare has folded HTTP Message Signatures into its Verified Bots programme, letting bot operators cryptographically sign requests rather than merely assert an identity, and AWS WAF added Web Bot Auth support in late 2025. We come back to what that means for your roadmap near the end of this guide.
The Crawl to Refer Ratio: A Fairness Metric Worth Tracking
If you take one new metric from this article, consider this one, because it converts an abstract grievance into a number you can put in a board deck.
The crawl to refer ratio divides the number of pages a platform’s crawlers fetch from your site by the number of referral visits that platform sends back. A ratio of 5 to 1 means the platform took five pages and returned one visitor. A ratio of 10,000 to 1 means it took ten thousand.
Cloudflare began publishing these on Radar in 2025 and the spread is extraordinary. In the original analysis, Cloudflare noted that for the period covering late June 2025 the ratios ranged from roughly 70,900 to 1 at the top end down to 0.1 to 1 at the bottom, with the lowest ratio belonging to a platform that sent ten times as many referrals as crawl requests. A year later, Cloudflare Radar data from late May 2026 put Anthropic’s crawler near 10,300 to 1, OpenAI’s GPTBot at 903.8 to 1, Perplexity’s bot at 192.9 to 1, Googlebot at 5.2 to 1 and DuckDuckGo’s assistant bot at 1.5 to 1.
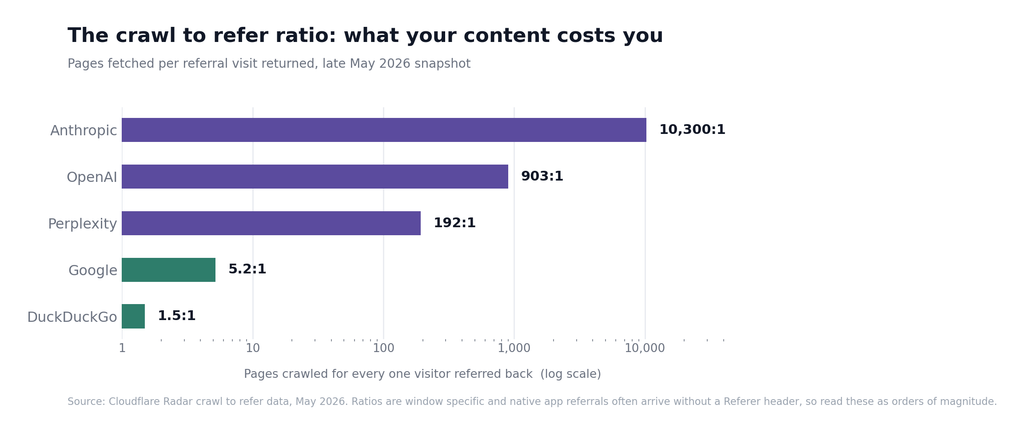
Two caveats belong with that chart and we would rather state them than let a reader discover them later and discount everything else.
Ratios are window specific and must never be averaged across windows. The same crawler can measure in the tens of thousands over one quarter and the low thousands over one week. Both are real. Neither is universal.
Native app referrals often arrive without a referer header. Cloudflare says so explicitly in its own analysis, which means these calculations may overstate the imbalance. The direction is not in doubt. The exact multiples should be read as orders of magnitude.
With those caveats, why track it on your own property?
Because it prices your content. Bandwidth, origin compute and cache pressure are real costs. A crawler with a five figure ratio is a line item.
Because it separates the four AI intents empirically. You do not need to guess whether a given operator is sending value. You can compute it monthly.
Because it makes the blocking decision defensible. “We blocked this crawler because it took 40,000 pages and sent 3 visitors last quarter” is an argument. “We blocked AI” is a policy stance that somebody will overturn the moment it costs a citation.
Because it will soon be a commercial input. Cloudflare announced that from September 15, 2026, its default settings will block mixed use crawlers from any page that hosts ads, applying to new customers, new sites from existing customers and all existing free accounts. Alongside it, Pay Per Crawl became Pay Per Use, paying publishers when content is actually used in an answer rather than merely fetched. Whatever your view of that specific policy, an era is starting in which crawler access is priced, and pricing requires measurement.
Compute the ratio per operator, per month, over at least a 28 day window. Crawl counts come from your edge or origin logs by verified operator identity, never by raw user agent. Referral counts come from your analytics by source. Publish both numbers with the window attached. That is a five line query and a genuinely defensible metric.
When the Bot Is the Customer: Measuring Agentic Traffic
Everything above assumes automation is something to exclude. The most interesting development of 2026 is that a growing slice of automation is your customer, acting through a machine.
HUMAN Security put the shift starkly in its 2026 benchmark report: for the first time, AI systems moved from merely reading the web to transacting on it. Monthly AI driven traffic grew 187 percent from January to December 2025, nearly tripling over the year, and more than 95 percent of that AI driven traffic concentrated in three industries: retail and e commerce, streaming and media, and travel and hospitality. Those are precisely the sectors sitting on the most valuable transactional data.
The commercial signals point the same way. Adobe Analytics measured 4,700 percent year over year growth in AI driven visits to United States retail sites during 2025. DataDome found that agentic browser traffic concentrated in e commerce and retail at roughly 20 percent of volume, real estate at 17 percent and travel and tourism at 15 percent, and that for one customer agentic traffic reached 9.75 percent of total traffic over a 30 day window.
This creates a measurement problem that is genuinely new, and it is not the one people expect. The problem is not that agents are hard to detect. Increasingly they are easy to detect, because they want to be trusted and signing requests is how they get trust. The problem is that the entire discovery and consideration phase now happens somewhere you cannot instrument.
A person asks an assistant to find them a supplier. The assistant reads twelve sites, compares them, discards nine, and presents three. The person picks one. If a visit happens at all, it happens at the end, with no referrer, no campaign parameters and no session history. Your analytics sees a direct visit with high intent and no origin story. Everything that actually determined the outcome, the comparison, the objection handling, the price check, happened inside a system with no tag on it.
This is the dark funnel problem that podcast and word of mouth marketers have lived with for years, except compressed from weeks into seconds and stripped of the promo code that used to be the workaround.
So what do you actually do?
Classify agent traffic rather than excluding it. An agent session and a scraper session should not sit in the same bucket. Tag them separately at collection time, based on verified identity and declared intent, and carry that tag through to reporting.
Build an agent influenced revenue metric. Any order whose session, or whose customer’s prior thirty days, contains verified agent activity gets flagged. It is a coarse measure. It is far better than nothing, and it is the only way to have an evidence based conversation about whether to invest in machine readable product data.
Watch the direct and unattributed segment closely. A rising direct segment with above average conversion and below average session depth is the signature of agent mediated discovery arriving at the decision point. Do not celebrate it as brand strength without checking.
Instrument at the transaction, not the session. If you support any agentic checkout protocol, capture order events through webhooks into your warehouse independently of your web analytics. The order is real even when the session is not, and the order is the only record that survives.
Ask what a machine can read. If an agent evaluates products on structured attributes, price, availability, return policy and delivery windows, then your product data is now a ranking factor in a channel where you have no bidding lever. Completeness of structured data has become a distribution question, not a technical hygiene question.
There is an honest caution to add. Measurement frameworks for this channel are immature and anyone selling you certainty is overselling. Practitioner guidance we broadly agree with suggests planning for eighteen to twenty four months before high confidence attribution exists in this area. The reasonable response is not to wait. It is to start capturing the raw signals now so that when the frameworks arrive you have history to apply them to. You cannot backfill an event you never recorded.
The security dimension deserves a sentence too, because it complicates the classification. HUMAN Security’s researchers make the point sharply: an AI agent browsing products, accessing an account and completing a checkout could be acting for a real customer or executing a fraud operation autonomously, and the behaviour is the same while the intent is not. This is why identity signals, signed requests, verified operators and mandate authorisation matter more than behavioural heuristics for this specific category. Behaviour cannot separate them. Cryptography can.
Fake Leads and the Contamination of Your CRM
If invalid sessions are a measurement problem, invalid leads are an operations problem, a morale problem and a forecasting problem at once. They are also, per unit of volume, the single most expensive form of pollution.
The reason is leverage. One fake session costs you a click and a row in a table. One fake lead costs you a click, a row, a conversion signal transmitted to a bidding algorithm, a sales development rep’s time, a sequence enrolment, a deliverability hit on your sending domain, a distorted pipeline forecast, and a permanent contaminant in the dataset your lifetime value model trains on.
Bot submission rates on unprotected forms run wide. Industry data compiled from fraud prevention platforms puts them between 15 and 40 percent, with some high value verticals such as insurance and mortgage exceeding 50 percent. Broader research on lead operations finds that nearly 73 percent of marketers report unreliable lead data quality that actively damages pipeline.
The motives behind fake leads are worth understanding, because the detection strategy depends on which you are facing.
Affiliate and partner fraud. Someone is paid per lead and manufactures leads. Usually high volume, usually clustered by source, often using recycled personal data so the records look plausible.
Competitive budget exhaustion. Someone wants your cost per click to rise and your sales team to be busy. Lower volume, better disguised, frequently timed to your peak season.
Testing and reconnaissance. Automated probes checking whether your form is exploitable, whether it will relay email, whether it leaks internal routing.
Incentivised humans. A real person completing your form for a reward. Passes every bot check because it is not a bot.
Simple spam. Link injection into your notification emails, aimed at whoever reads the inbox.
The detection stack that works, in the order we would build it, looks like this.
Never treat a submission as a conversion. Treat it as a claim awaiting verification. This single reframing changes everything downstream, including what you transmit to advertising platforms.
Add invisible friction before visible friction. Honeypot fields, submission timing thresholds, per address and per fingerprint rate limits, and a required token proving the page actually rendered. These cost legitimate users nothing.
Verify the contact channel asynchronously. Syntax and domain checks are table stakes. Mailbox existence checks, disposable domain detection and, for high value forms, a confirmation step move you from claiming a human to proving one.
Ask one question a script cannot fake convincingly. A qualifying field with no obvious correct answer, such as monthly budget or current provider, filters lazy automation and lazy humans alike. Expect lower volume and better quality. For most lead economics that trade is profitable.
Score, do not just block. Assign every submission a confidence score and route by band. High confidence goes straight to sales. Medium goes to nurture with a verification step. Low is quarantined but retained, because a quarantined record you kept is evidence and a deleted record is a gap in your dataset.
Close the loop with outcomes. Every lead eventually resolves into contacted, unreachable, disqualified or won. Feed that resolution back into your scoring weekly. Outcome data is the only ground truth in this entire discipline, and it is the layer fraud cannot fake, because faking it requires actually buying something.
One organisational note. The team that owns lead volume is usually not the team that suffers from lead quality, and that misalignment is why this problem persists in companies that clearly have the technical capacity to fix it. If marketing is measured on leads and sales is measured on revenue, nobody owns the gap. Make verified leads the reported number for both teams and the problem tends to solve itself within a quarter.
What Ad Fraud Actually Costs
It helps to know the size of the pool you are swimming in, with the caveat that every number in this section is an estimate produced by a party with a point of view, including estimates produced by vendors who sell the remedy.
Juniper Research has tracked this longest. Its analysis found global advertising spend lost to fraud rising from $84 billion in 2023 to a projected $172 billion by 2028, growth of 105 percent, alongside a forecast that fraudulent clickthroughs would rise past 65 billion by 2028. Earlier editions of the same series put losses at $68 billion in 2022, rising from $59 billion in 2021, with five markets accounting for 60 percent of global losses.
Set against that, the Association of National Advertisers has quantified waste from a different angle: not fraud specifically, but everything that fails to reach a valid, viewable, measurable impression. Its December 2023 study concluded that just 36 cents of every dollar entering a demand side platform effectively reached the end consumer, with transaction costs consuming 29 percent and 35 percent lost to unmeasurable or low value environments. By the second quarter of 2025 the ANA reported $26.8 billion in global media value still lost each year to inefficiency, up 34 percent from the $20 billion identified in its first report, even as made for advertising exposure fell to a median of just 0.8 percent.
That last detail rewards a moment’s attention, because it is a genuinely encouraging finding buried in a discouraging headline. The industry attacked a specific, nameable problem and largely solved it. Made for advertising inventory went from roughly two thirds of programmatic waste to under one percent on a median basis. Waste overall rose anyway, because the money moved somewhere else. This is the pattern to expect from every countermeasure discussed in this article: specific defences work, and the adversary reallocates. That is not an argument against defending. It is an argument for measuring continuously rather than declaring victory.
What should you take from these figures for your own planning? Not the totals. The totals are industry aggregates covering channel mixes that look nothing like yours. Take three things instead.
Take the rate, not the dollars. A planning assumption of 15 to 25 percent invalid traffic on open web display, lower on branded search, higher on mobile app inventory, is defensible against multiple independent datasets.
Take the variance seriously. Fraudlogix found invalid traffic rates ranging from 0.85 percent in Belgium to 67.52 percent in Honduras, with Western Europe cleanest in aggregate. If your campaigns run broad geographic targeting, your blended rate is an average of wildly different populations and the average tells you almost nothing.
Take the direction. Every series, from every vendor, using every methodology, points the same way over the long run.
When the Verification Vendors Themselves Miss
Honesty requires including the part of this story that is uncomfortable for the entire measurement industry, ours included.
In March 2025, the research firm Adalytics published a 240 page report examining whether ad tech vendors were serving advertisements to declared bots. The report, covered by the Wall Street Journal, detailed instances of brands serving ads to known bots appearing on the IAB Tech Lab’s International Spiders and Bots list and the Trustworthy Accountability Group’s Data Center IP List. These were, in the words of the coverage, bots that were not even trying to hide that they were bots. Affected advertisers reportedly included Fortune 500 brands and government agencies.
The vendors disputed the framing vigorously and the dispute matters. DoubleVerify responded that the report was based on an incorrect premise, arguing that general invalid traffic, if not filtered pre bid, is removed post bid from the set of billable impressions. Adalytics countered that its report was explicitly about pre bid services. DoubleVerify sued Adalytics for defamation and false advertising in May 2025, and in April 2026 a federal judge ruled that DoubleVerify could proceed with those claims. The litigation is unresolved and we take no position on its merits.
What is not in dispute is the underlying lesson, and it is the reason we include this section at all. Accreditation is a statement about process, not a guarantee about outcomes. A vendor can hold a legitimate accreditation, run a legitimate methodology, and still not catch a given class of traffic in a given integration, for reasons ranging from technical limitation to placement in the request chain.
A parallel finding from 2026 makes the same point from a different direction. A joint analysis by the Trustworthy Accountability Group, the ANA and Fiducia produced the first rigorous sizing of AI generated slop in programmatic media, concluding it accounts for between 1.3 and 2.4 percent of open web programmatic spend. The headline number is modest. The finding underneath it is not. Slop inventory outperformed clean inventory on conventional quality metrics. It recorded an invalid traffic rate of 0.05 percent against 0.32 percent for clean supply, higher viewability at 77.2 percent against 74.9 percent, graded as premium more than 70 percent of the time once measurability was factored in, and commanded a higher effective price at $7.08 against $6.15.
Read that again, because it is the most important paragraph in this section. Mass produced, low value, machine generated content scored better on every standard quality metric than genuine inventory, and therefore cost more. The metrics were not broken in a technical sense. They were measuring the wrong things, and a system optimised against them will systematically prefer the worse asset.
The lesson generalises well beyond programmatic. Any quality metric that can be satisfied without producing value will eventually be satisfied without producing value. Viewability measures whether pixels rendered. Invalid traffic rates measure whether the requester was automated. Neither measures whether a person cared. This is why the final layer of any verification system has to be outcome truth, and why we put it at the top of the evidence ladder.
The Evidence Ladder: How to Actually Verify a Visitor
Everything up to this point has been diagnosis. This is where the practical work starts.
The first principle of verification is that no single signal is proof. Every individual check has a false positive story and a false negative story, and any system that makes a binary judgement from one signal will be wrong often enough to be useless. What produces confidence is agreement across independent layers, weighted by how expensive each layer is to forge.
We think of it as a ladder. Cheap checks at the bottom, catching high volume and low sophistication. Expensive checks at the top, catching the traffic that matters most. Every request gets a score, and the score carries a confidence interval rather than a verdict.
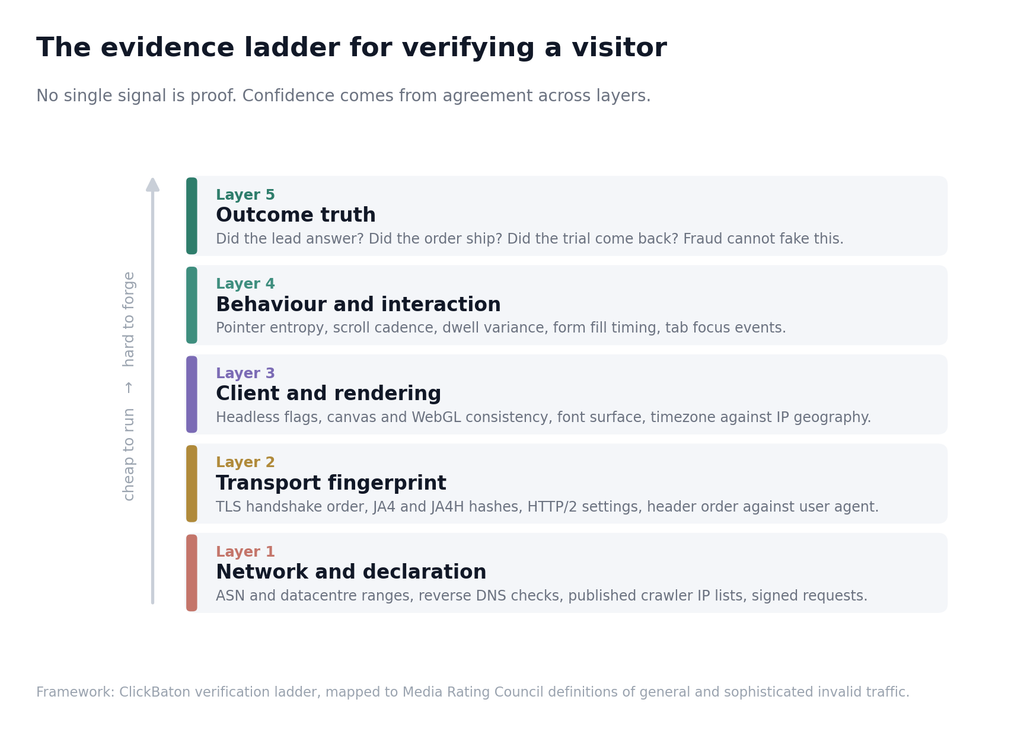
Layer one: network and declaration
The cheapest layer, and the one most systems stop at.
Autonomous system and address range. Which network is this request from? Traffic from cloud hosting and content delivery providers behaves very differently from consumer broadband. Fraudlogix data shows that cloud hosting and content delivery providers exhibit dramatically higher fraud rates than residential providers. Maintain your own view of network reputation rather than relying purely on a third party feed, because feeds lag.
Reverse and forward confirmed DNS. For declared crawlers, resolve the address to a hostname and resolve that hostname back. Google, Microsoft and most major operators publish the expected pattern. This one check eliminates the majority of crawler impersonation, and it is astonishing how few sites do it.
Published address lists. Major operators publish their ranges as machine readable files. Fetch them on a schedule, do not hard code them.
Signed requests. The emerging standard here is Web Bot Auth, built on HTTP Message Signatures. A bot signs each request with a key, and you verify against a published key directory. This is qualitatively different from every other check on this layer because a signature is checkable while a user agent string is free text anyone can copy. Cloudflare, AWS, Akamai and others already verify these in production.
User agent claims. Useful as a declaration of intent, worthless as evidence. Record it. Never trust it alone.
Layer two: transport fingerprint
Below the application, above the network, sits a layer most automation forgets to disguise.
TLS handshake characteristics. The order of cipher suites, the extension list, the supported groups and the signature algorithms a client offers form a fingerprint. The JA4 family of fingerprints has largely superseded the older JA3 method and is the practical standard. A client claiming to be Chrome 141 on Windows should produce a handshake consistent with Chrome 141 on Windows. Many automation libraries produce a handshake consistent with a Python or Go standard library, because that is what they are.
HTTP/2 frame settings. Header table size, initial window size, max concurrent streams, and the order in which settings frames are sent all vary by client implementation and are rarely spoofed.
Header order and completeness. Real browsers send a stable, well known ordering of headers. Automation frequently sends alphabetised headers, omits headers a real browser always includes, or includes headers in an order no browser produces.
This layer is enormously valuable because it is invisible to the operator writing the bot. They set the user agent because that is the field they know about. The mismatch between the claimed identity and the actual handshake is one of the highest signal, lowest false positive checks available.
Layer three: client and rendering
Now we ask the client to prove it is a browser by doing browser things.
JavaScript execution proof. A challenge that requires computing a value and returning it. Trivially defeated by headless browsers, but it removes everything that is not a browser at all, which is a large volume.
Headless and automation indicators. Automation frameworks leave traces. Some are obvious properties on the navigator object, some are subtler behavioural differences in how the runtime handles specific operations. The obvious ones are patched by every serious operator, which is precisely why finding one is such a strong signal: it tells you this operator is unsophisticated, and unsophisticated operators come in volume.
Rendering surface consistency. Canvas and WebGL outputs, available fonts, supported codecs, screen dimensions, device pixel ratio and hardware concurrency should form a coherent picture. A client claiming to be an iPhone with a desktop graphics renderer and 32 logical cores is not an iPhone.
Environment coherence. Timezone against address geography. Declared language against target market. Reported screen size against device class. Individually weak, collectively strong.
A necessary caution: this layer produces the most false positives of any. Privacy focused browsers, hardened configurations, corporate managed devices, assistive technology and older hardware all produce unusual fingerprints. Never block on this layer alone. Use it to lower confidence, and require corroboration before acting.
Layer four: behaviour and interaction
If the client is a browser, is a person driving it?
Pointer movement entropy. Human cursor paths are noisy, curved and irregular. Scripted paths are straight, evenly sampled or absent entirely.
Scroll dynamics. People accelerate, overshoot, pause and reverse. Scripts scroll linearly or jump.
Dwell variance across a session. Human page times vary enormously. Automated ones cluster around a configured interval.
Form interaction timing. Time to first keystroke, inter field intervals, correction and backspace events, focus and blur ordering. Filling six fields in 400 milliseconds is not a fast typist.
Tab visibility and focus events. Real sessions lose and regain focus. Headless sessions frequently never do.
This layer is where the arms race is fiercest, because sophisticated automation now simulates all of it. Treat it as a filter that raises the cost of attack rather than a wall, and pair it with the layer above and the layer below.
Layer five: outcome truth
The top of the ladder, and the only rung that cannot be forged cheaply.
Did the lead answer the phone? Did the email land and get opened by a human at a plausible interval? Did the order ship without a chargeback? Did the trial account return in week two? Did the subscription renew?
Every layer below this one estimates. This layer observes.
The practical implementation is a feedback loop. Take the confidence score assigned at session time, join it to the outcome that eventually resolved, and measure the score’s predictive power. If sessions scored 0.9 confidence convert to reachable leads at four times the rate of sessions scored 0.4, your scoring works. If they do not, it does not, and no amount of fingerprint sophistication will save it.
This loop is the difference between a bot detection product and a measurement system. A bot detector tells you what it thinks. A measurement system tells you how often it was right. Insist on the second, including from us.
The Residential Proxy Problem
There is one specific development that deserves its own section, because it invalidates the assumption most detection systems were built on.
For twenty years, the address a request came from was a meaningful signal. Datacentre ranges implied automation. Residential ranges implied people. That heuristic is now broken at scale.
Residential proxy services route traffic through addresses assigned to consumer devices and home routers, so a request from a scraping operation in one country presents as ordinary broadband in another. The scale is difficult to overstate. Lumen’s Black Lotus Labs reports the global botnet population it observes approaching 60 million victim addresses, with roughly one in four based in the United States, and around ten distinct botnets controlling about one million active victims daily. Nokia’s research team, working with Comcast’s threat lab, documented a single botnet family fragmenting into more than twenty competing networks with daily active endpoint counts climbing from roughly one million to eight or nine million over a year.
Bitsight’s investigation into the economics found the market is heavily subsidised by the malware ecosystem, with a baseline of 20 percent of proxy exit nodes actively communicating with its sinkholes. Their conclusion is one every measurement team should internalise: relying purely on static address reputation is no longer viable.
The consequences for measurement are direct and unforgiving.
Country reports become unreliable. Traffic presenting as your home market may originate anywhere. Geographic performance analysis built on address geolocation alone is now an estimate with an unknown error bar.
Address blocklists decay in hours. Research cited in industry analysis found that 89.7 percent of malicious residential addresses were active for less than a month before rotating out of the pool. A blocklist is a snapshot of a population that has already moved.
Disruption produces displacement, not reduction. After a major proxy network disruption in January 2026, researchers observed residential sessions linked to that network declining while hosting based sessions increased over the same period, consistent with operators simply replacing lost residential capacity with datacentre infrastructure.
None of this means address data is worthless. It means address data has been demoted from evidence to context. Use it to inform a score. Never use it to reach a verdict. The layers above it, transport fingerprint and behaviour, and the layer above those, outcome truth, carry the weight now.
Building a Truth Layer
Here is the architectural point that took us longest to accept, and that we now consider the whole thesis: you cannot fix this inside your analytics platform.
Analytics platforms are consumers of events. By the time an event arrives, the decision about whether it should exist has already been made, by a tag that fired because something requested a page. Filtering after the fact is always partial, always retrospective and never auditable.
What works is a separate layer that sits between raw traffic and every downstream consumer. Collect, classify, reconcile, decide. Analytics, your advertising platforms, your CRM and your warehouse all consume the output of that layer rather than the raw stream.
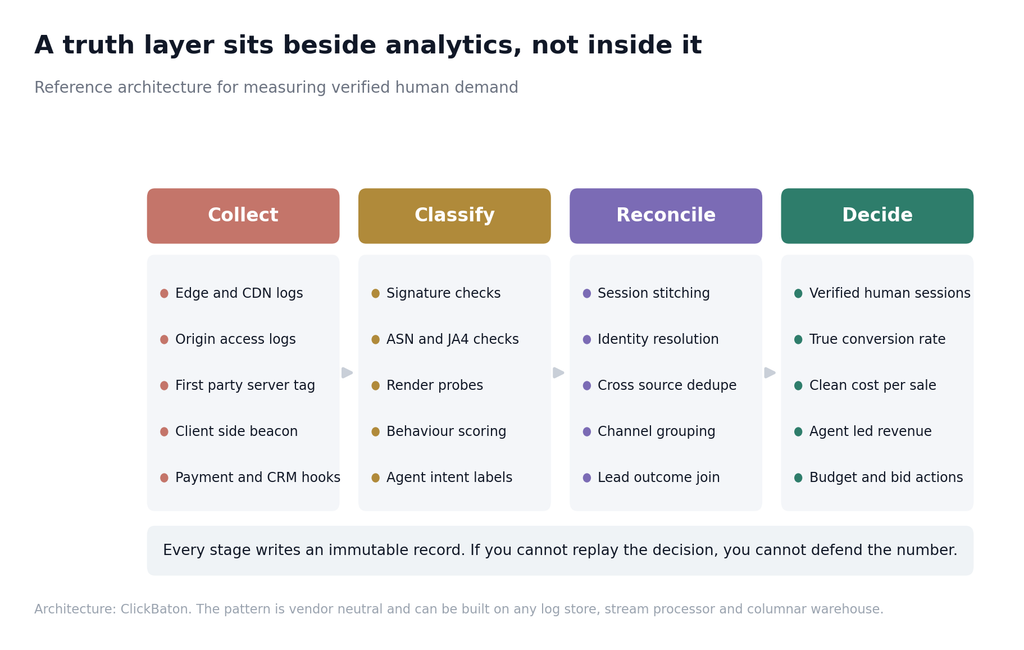
Collect: gather more than one view
The foundational rule is redundancy. Any single collection method can be defeated. Two methods that disagree tell you something a single method never could.
Edge and origin logs capture every request, including those that never execute JavaScript. This is your ground truth for volume, and it is the only place you will ever see the traffic your tag missed.
A first party server endpoint receives events from your own domain rather than a third party one. This survives content blockers and browser restrictions far better than a third party tag, and it puts request headers and transport metadata in your hands at the moment of collection.
A client beacon captures the rendering and behavioural signals that only exist in a browser context.
Transaction and CRM webhooks capture outcomes that arrive out of band, including agentic orders that never produced a session.
The discrepancy between these sources is itself a metric. If your logs show 140,000 page requests and your tag reports 100,000 sessions, that 40,000 gap is not noise. It is a population, and you should know what it is made of.
Classify: decide once, centrally
Every request gets a classification and a confidence score, computed in one place, using the ladder above.
Two design decisions matter enormously here.
Classify, do not just filter. A filtered request is gone. A classified request is retained with a label, which means you can compute how much you excluded, audit the decision, revisit it when your rules change, and reprocess history when you learn something new. The excluded population is data, not garbage.
Score continuously, not once. A session that looks human at page one and inhuman at the form should be reclassified. Confidence is a function of accumulated evidence and it should move as evidence accumulates.
Reconcile: make the identifiers line up
This is the least glamorous stage and the one that sinks most implementations.
You need a stable session identifier that appears in your edge logs, your server events, your client beacon and your CRM records. Without it you cannot join the layers, and without the join the whole architecture is four separate dashboards that disagree.
Practical guidance from our own build: generate the identifier at the edge on first request, propagate it in a first party cookie and a response header, echo it in every client event, and carry it into the CRM as a field on the lead record. Then join on it everywhere. It sounds obvious. It is the single most common thing we see missing.
Decide: publish clean numbers and act on them
The output of the layer is not a report. It is a set of numbers that other systems consume.
Analytics receives events for verified human sessions. Advertising platforms receive conversion events only for verified conversions. The CRM receives leads with a confidence band attached. The warehouse receives everything, labelled, for analysis. Finance receives the clean cost metrics.
And every stage writes an immutable record of what it decided and why. If you cannot replay the decision, you cannot defend the number, and the first time somebody senior challenges a 20 percent drop in reported sessions you will need to defend it in detail.
How ClickBaton Approaches This
We should be direct about our position: we make a product in this category, so treat this section as disclosed interest rather than neutral analysis. We include it because the design choices are the ones we would argue for even if you built it yourself, and because a guide that describes a problem without describing an implementation is a brochure.
We verify crawlers with a ladder, not a list. A request claiming to be a search or AI crawler passes through progressive checks: does the declared identity exist in our registry, does the address fall inside the operator’s published ranges, does forward confirmed reverse DNS resolve correctly, and does the request carry a valid signature where the operator supports one. A claim that fails a rung is not necessarily blocked, but it stops being treated as the thing it claims to be. Given that impersonation of named agents now runs into the millions of requests, this ladder has become the single highest value component we ship.
We classify agents by function and intent, not by brand. Our registry carries a substantial catalogue of known agents, each mapped to a function and an inferred intent, so that a training crawler, a search indexer, a live retrieval fetcher and an agentic browser are four different things in your reports rather than one undifferentiated bucket labelled AI. That distinction is what makes the crawl to refer ratio computable per operator and what lets you set policy per intent rather than per company.
We keep the excluded population. Everything classified as non human is retained with its label, its score and the evidence that produced the score. You can see what was excluded, how much, from which sources and why, and you can reprocess a period when your rules improve. An invisible filter is an assumption. A visible, auditable, reprocessable filter is a measurement.
We store events in a columnar engine because the questions are analytical. Traffic verification generates a very large number of narrow rows that you query by dimension and time window. That is exactly the shape a column store is built for, which is why ClickBaton runs its event storage in ClickHouse with a relational database for configuration and a cache for hot lookups. The specific technology is less important than the principle: do not store verification data in the same place you store application data, because the access patterns are opposites.
We treat protection and measurement as separate outputs of the same pipeline. The same classification that lets you exclude a request from a report can, if you choose, drive a blocking rule, a rate limit or a tarpit at the edge. But those are decisions, not defaults. Plenty of traffic should be measured and excluded while remaining perfectly welcome to fetch the page.
We put narration on the numbers. A dashboard that says invalid traffic rose to 31 percent is a fact. A dashboard that says invalid traffic rose to 31 percent because a single autonomous system began sending traffic that fails transport fingerprint checks while presenting a current Chrome user agent is an action. The second one is what people actually need at nine in the morning when they have twenty minutes before a client call.
We assume the customer will check our work. Every score is decomposable into the signals that produced it. If we cannot show why, we do not expect to be believed.
You do not need us to do any of this. Cloudflare, Akamai, DataDome, HUMAN, Fastly and others each solve overlapping parts of it, and a competent team with edge logs, a warehouse and a month can build a serviceable version of the collect and classify stages alone. What we would argue against is doing nothing on the grounds that a complete solution is expensive. The first 60 percent of the value in this discipline comes from the cheapest 20 percent of the work, which is simply looking at your own logs honestly.
The Clean Metric Set: Definitions Worth Adopting
If you change nothing else, change your definitions. Metrics are contracts about meaning, and the current contracts were written for a web that no longer exists.
Here is the set we use and recommend. Each definition is deliberately conservative, because the purpose is to produce a number you can defend rather than a number you enjoy.
Verified Human Sessions. Sessions where the visitor cleared your verification threshold across at least two independent layers of the evidence ladder. This replaces sessions as your top of funnel number everywhere. Report it alongside raw sessions for at least two quarters so the organisation can see the gap and get used to it.
Human Traffic Ratio. Verified human sessions divided by total recorded sessions, expressed as a percentage. This is your single most important diagnostic. Track it weekly, per channel, per campaign, per landing page and per country. Movement in this ratio explains more anomalies than any other number in your stack.
True Conversion Rate. Verified conversions divided by verified human sessions. Both the numerator and the denominator are cleaned. Reporting a clean numerator against a dirty denominator, or the reverse, produces a number worse than the one you started with.
Verified Conversion. A conversion where the acting entity cleared verification and, for lead generation, where the contact channel was confirmed reachable. This is the only event type that should ever be transmitted to an advertising platform as a training signal.
Reachable Lead Rate. Verified leads divided by total submissions. This is the number that reveals form spam faster than anything else, and it is the one to put in front of a sales leader, because it is measured in their language.
Clean Cost Per Acquisition. Total media spend divided by verified conversions. Expect this to be materially higher than your reported figure. That is the point. You were never paying the reported number, you were only reporting it.
Agent Influenced Revenue. Revenue from orders whose session or whose customer’s preceding thirty days contain verified agent activity. Coarse, imperfect and directionally essential for anyone in retail, travel or media.
Crawl to Refer Ratio, per operator, per window. Pages fetched by a verified operator divided by referral visits from that operator’s platform. Always stamped with the window. Never averaged across windows.
Verification Coverage. The share of traffic that received a classification at all, as opposed to passing through undecided. This is the MRC decision rate concept applied to your own stack, and it is the honesty check on everything else. A 95 percent human traffic ratio computed across 30 percent coverage means nothing.
Discrepancy Rate. The gap between your edge log request counts and your analytics session counts, normalised. A stable discrepancy is fine. A moving one means something changed in your collection, and you want to know before the monthly report does.
Two implementation notes that will save you arguments later.
Publish the definition next to the number. Every one of these metrics has a threshold or a window baked into it. If the threshold is not visible, somebody will compare two periods with different thresholds and reach a confident wrong conclusion.
Version your definitions. When you change a threshold, increment a version and record the date. Then, when your chart shows a step change, you can tell instantly whether the world changed or your definition did. This one discipline has saved us more embarrassment than any other.
Your First Thirty Days
Enough theory. Here is the sequence we would follow to go from no visibility to defensible numbers, arranged so that each week produces something usable on its own.
Week one: establish the gap
The goal this week is not to fix anything. It is to size the problem with evidence, because you will need that evidence to get the resources for everything else.
Pull raw request logs for a full month. From your content delivery network if you have one, from your origin if you do not. Full month, not a sample, because bot traffic is bursty and a week can mislead badly in either direction.
Count requests for HTML documents only. Strip assets, images, fonts, API calls and preflight requests. You want the population that could plausibly have been a page view.
Group by autonomous system. Sort descending. In our experience this single chart is the most persuasive artefact in the entire exercise, because the concentration is usually startling: a handful of networks accounting for a share of your traffic that nobody in the room expected.
Perform forward confirmed reverse DNS on your top declared crawlers. Count how many claims fail. This number is usually the moment the conversation changes.
Compute your discrepancy rate. Log based page requests against analytics sessions for the same period. Write the number down. It is your baseline.
Deliverable: one page showing total requests, requests by network category, failed crawler verifications, and the log to analytics gap. That page is your business case.
Week two: instrument collection
Stand up a first party collection endpoint on your own domain. Same origin as the site, not a third party subdomain owned by a vendor. This is the change with the longest tail of benefit and it is worth doing properly.
Generate a session identifier at the edge. First request, propagated in a first party cookie and available to server side code.
Capture transport metadata at collection. Address, autonomous system, TLS fingerprint where your stack exposes it, header order, full header set. Store it raw.
Add a lightweight client beacon for rendering and behavioural signals. Keep it small. This is a signal collector, not an analytics product.
Start writing everything to a columnar store. You will regret sampling. Storage is cheaper than the meeting where you cannot answer a question about last month.
Deliverable: every request now produces a row containing a joinable identifier and enough metadata to classify it later, even if you have not written the classifier yet.
Week three: classify and quantify
Implement layer one and layer two checks. Network category, published range membership, forward confirmed DNS, signature verification where available, transport fingerprint consistency against declared user agent. These two layers alone typically account for the large majority of catchable pollution, and they require no client cooperation at all.
Assign a confidence score rather than a label. Zero to one, with the contributing signals recorded alongside it.
Backfill the month you pulled in week one. You now have a before and after on the same data.
Compute your first human traffic ratio, by channel. Expect asymmetry. Direct and display will usually look worst. Branded search and email will usually look best.
Deliverable: a human traffic ratio for every channel and campaign, with the confidence distribution behind it.
Week four: act, and close the loop
Split your reporting. Every report now shows raw and verified side by side. Do not remove the raw number yet. People need to see the gap for themselves before they will trust the corrected figure.
Gate your conversion transmission. Only verified conversions go to advertising platforms. This is the highest value single action in the entire programme and it is usually a small change in a tag manager or a server container.
Add form protection. Honeypot, timing threshold, rate limiting, render proof token and asynchronous contact verification. Not a visible challenge unless the score demands it.
Join outcomes back to scores. Take last quarter’s leads, join them to their session confidence scores, and measure whether the score predicted reachability. This is the moment you find out whether your system works.
Deliverable: a verified metric set, a cleaned conversion feed, and a validation study showing the predictive power of your scores.
The thirty first day
Set the cadence, because this is not a project that completes.
Weekly: human traffic ratio by channel, discrepancy rate, verification coverage. Monthly: crawl to refer ratio by operator, clean cost per acquisition against reported, reachable lead rate by source. Quarterly: rescore a historical period with current rules and check for drift, re run the outcome validation, and review which detection layers are carrying the weight.
One warning from experience. Expect reported performance to get worse before anybody thanks you. Sessions fall. Conversions fall. Cost per acquisition rises. Every one of those movements is an improvement in accuracy and every one of them looks like a decline on a chart. Prepare the narrative before you ship the change, brief the people who will see it first, and lead with the sentence that actually matters: the numbers did not get worse, they got true.
Validation: Proving the Number Instead of Asserting It
Here is the uncomfortable question that will eventually be put to you, probably by a chief financial officer: how do you know your clean numbers are right?
It is a fair question and it has a real answer, but the answer is not more detection. Detection produces estimates. What settles the question is experimentation, and this is the part of the discipline with the deepest and most credible research literature behind it.
The foundational work is more than a decade old and it remains the sharpest illustration of why observed metrics mislead. In a series of large scale field experiments at eBay, published in Econometrica, Thomas Blake, Chris Nosko and Steven Tadelis measured the causal effect of paid search advertising by turning it off in randomly assigned markets and comparing outcomes. Their conclusion, stated in the abstract, is worth reading slowly: returns from paid search are a fraction of non experimental estimates. As an extreme case they found that brand keyword advertisements had no measurable short term benefit at all, and that for non brand keywords the positive effect on new and infrequent users was outweighed by spending on frequent users whose behaviour the advertising did not change, producing negative average returns.
Note what that experiment did and did not require. It did not require identifying a single bot. It did not require cookies, identity resolution or a tag. It compared aggregate outcomes between markets that received advertising and markets that did not. Causality was established structurally rather than inferred from the click stream, which is exactly why it survives everything discussed in this article.
That is the tool you want. Here is how to use it for verification specifically.
Geographic holdout tests
Split comparable markets into test and control. Suppress a channel in the control markets. Measure the difference in total outcomes, not tracked outcomes.
The critical detail is that final phrase. You are measuring revenue, orders, qualified opportunities or another business outcome that exists independently of the tracking system. The whole point is to use a measurement that pollution cannot reach. If your holdout analysis relies on platform reported conversions, you have carefully built an experiment that inherits the exact bias you were trying to test for.
Geographic experiments have become the dominant form of incrementality testing precisely because they survive signal loss completely: you do not need to track any individual, only aggregate outcomes in test and control regions. No cookies, no device identifiers, no consent dependency.
Design guidance that matters in practice:
Match markets on outcome patterns, not on population. Two cities of similar size can have completely different seasonality. Match on revenue history.
Run for at least four weeks. Two weeks is almost always underpowered, and an underpowered test that comes back inconclusive will be read by somebody as evidence of no effect.
Map your full media plan first. If national television, regional radio or an influencer campaign is running into your control markets, your holdout is contaminated and the result is worthless.
Accept the cost. A holdout means deliberately forgoing some conversions to learn the truth. That is the price of the information, and it is almost always cheaper than a year of misallocated budget.
On demand shutoff tests
A blunter instrument for a specific question. Pause a suspect placement, keyword group or supply path entirely for a defined window and watch whether total business outcomes move.
The results can be brutally clarifying. Documented examples include a grocery chain that paused all non branded paid search in twelve test markets and measured a sales lift of zero percent, concluding the budget was redundant and reallocating it. Whatever your opinion about that specific case, the method is sound and the question it answers is the only one that matters: if this spend disappeared, would anything change?
Cross source triangulation
You do not need an experiment to catch many problems. You need two independent sources and the discipline to compare them.
Compare platform reported conversions against your own verified conversions. Compare your analytics revenue against your payment processor. Compare lead volume against contacted lead volume. Compare edge log requests against analytics sessions.
Each pair produces a ratio. Stable ratios are healthy even when they are not one to one. Moving ratios are the alarm. Chart them, put thresholds on them, and alert on deviation. This is cheap, it runs continuously, and it catches most incidents faster than any human review.
Calibrated modelling
For portfolio level questions, marketing mix modelling has returned to prominence because it works on aggregate data and does not depend on user level tracking. Its long standing weakness is that it measures correlation. The current best practice is to calibrate the model with experimental results, so that the causal anchors from your holdout tests constrain the model’s estimates. Practitioner consensus in 2026 is that the most defensible measurement programmes combine modelling for the portfolio view, incrementality testing for causal ground truth, and platform attribution for tactical signal, with each method informing the others rather than competing.
For a team without a modelling function, the minimum viable version of this is one sentence: run one well designed geographic holdout on your largest channel this quarter. A single good experiment is worth more than a year of attribution reports, and it gives you a causal number to check every other number against.
Governance: Who Owns the Number
Technical solutions fail for organisational reasons more often than technical ones. This section is short because the point is simple, and important because it is the step teams skip.
Somebody must own the definition of a verified session, by name. Not a team, a person. That person approves threshold changes, publishes the version history, and is accountable for the accuracy of the top of funnel number. In most organisations this belongs in analytics or marketing operations rather than in security, because the primary consumer is a budget decision, not a threat model.
Marketing and sales must be measured on the same number. The reason fake leads survive in companies that could easily detect them is that marketing is compensated on volume and sales absorbs the quality cost. Aligning both teams on verified leads removes the incentive gap in a single stroke, and it is usually the highest impact change available to a leadership team.
Security and marketing must share the classification, not duplicate it. Both need the same underlying verdict for different purposes. Two systems producing two answers about the same request is a guaranteed source of meetings.
Finance should see the clean cost metrics. If cost per acquisition rises when verification switches on, finance needs to understand why before they see it in a variance report. Brief them early, frame it as accuracy, and show the arithmetic.
Vendor claims need a standard evaluation. When anyone, including us, proposes a traffic quality product, ask four questions in this order. What fraction of requests do you reach a verdict on? What is your false positive rate on legitimate human traffic and how was it measured? Can I see the signals behind an individual verdict? Can I reprocess a historical period with updated rules? A vendor who cannot answer the first question is selling a filter, not a measurement, and a vendor who cannot answer the third is asking for faith.
Write down what you do not know. Every measurement system has blind spots. Ours have them. Document yours, publish them alongside the metrics, and revisit the list quarterly. A stated limitation is a strength. An unstated one is a liability that will eventually surface at the worst possible moment.
What Good Looks Like: Thresholds and Benchmarks
People always ask for target numbers, and target numbers are dangerous because the correct value depends heavily on vertical, channel mix, geography and price point. With that caveat stated as loudly as we can state it, here are the planning ranges we work from.
Human traffic ratio. For a typical business site with a mixed channel portfolio, we treat 70 to 85 percent as normal, above 85 percent as good, and below 60 percent as an active investigation. If you run a marketplace, a travel property, a ticketing site or anything with public pricing that competitors want, expect to sit far lower and do not panic. Imperva’s finding that bad bots made up 48 percent of all traffic to travel sites means humans are a minority audience in that vertical by default.
By channel, expect a wide spread. Branded search and email typically show the highest human ratios. Open web display, certain affiliate sources and untargeted programmatic typically show the lowest, consistent with the 20 percent web and 39 percent mobile app invalid traffic rates Pixalate reports across billions of impressions. Direct traffic is the wildcard and deserves specific attention, since it is where both unattributed human demand and undeclared automation accumulate.
Reachable lead rate. Above 90 percent is good. Between 75 and 90 percent is normal for paid acquisition. Below 70 percent means the form is being farmed and should be treated as an incident rather than a trend.
Verification coverage. Below 90 percent, be sceptical of every other number you compute. Coverage is the foundation and everything else is built on it.
Discrepancy rate. The absolute value matters less than its stability. A site consistently showing 35 percent more log requests than analytics sessions is fine. The same site jumping to 60 percent in a week has a story worth reading.
Conversion rate context. Because pollution moves the denominator, it helps to know where genuine benchmarks sit. Across independent 2026 datasets, global e commerce conversion rates cluster between roughly 1.4 percent and 3 percent depending on the population measured, with enormous variation by category: food and beverage at the top and luxury and jewellery under 1 percent. The honest reading of that spread is that any single global benchmark is close to meaningless, and the only comparison worth making is against your own verified history.
Crawl to refer ratio. There is no target, only a decision threshold. Set a number above which an operator’s access requires justification. Given published ratios ranging from single digits for traditional search to five figures for some AI operators, most sites will find their own line somewhere in the hundreds.
Rate of change matters more than level. A human traffic ratio of 68 percent that has been stable for six months is a fact about your vertical. The same ratio arrived at from 84 percent in three weeks is an incident. Alert on the derivative, not the value.
The Road Ahead: Signed Agents and the Verified Web
The current situation, where a request asserts an identity and a website guesses whether to believe it, is not stable. Something has to replace it, and the outline of the replacement is already visible.
Cryptographic bot identity is arriving faster than most people realise. Web Bot Auth builds on HTTP Message Signatures, the mechanism standardised as RFC 9421. A bot signs each request with a key, publishes its public keys in a discoverable directory, and includes a signature agent header identifying which directory to check. The site verifies the signature. The difference from every previous approach is categorical: a signature is verifiable, a user agent string is a claim.
Adoption has run ahead of standardisation, which is unusual and tells you something about how badly the ecosystem needed this. Cloudflare integrated HTTP Message Signatures into its Verified Bots programme and simplified enrolment for bots that sign their requests. AWS WAF announced support in November 2025, automatically allowing verified agent traffic by default and refining its previous behaviour of blocking unverified AI bots. Akamai, Vercel and others followed. The IETF chartered a working group. As of August 2026 the drafts are still individual rather than adopted, and there are real interoperability wrinkles: the wire format for the signature agent header changed from a bare string to a structured dictionary, and implementations have not fully converged on the new form.
The practical takeaway for your roadmap is not to wait for the standard to settle. Start verifying signatures where operators already provide them, and record whether a request was signed as a first class field in your data model. In eighteen months, signed versus unsigned will be one of the most useful segmentation dimensions you have, and only if you have been storing it.
Access to content is becoming priced. Cloudflare’s September 2026 change, blocking mixed use crawlers by default on pages that carry advertising, is significant less for its immediate effect than for the principle it establishes. The reasoning is that an advertisement is a signal the site owner intended a human to arrive, which makes scraping that page for training or answer generation a different transaction from search indexing. Alongside it, Pay Per Crawl became Pay Per Use, compensating publishers when content is actually used rather than merely fetched.
Reasonable people disagree about whether this is good for the open web. What is not arguable is the operational consequence: if access is priced, access must be metered, and metering is a measurement problem. Sites that cannot attribute crawler load by operator, purpose and outcome will be unable to participate in any of these arrangements on informed terms.
The bot versus human binary is dissolving into something more useful. The interesting question is no longer whether a request came from software. Almost all of them do, in the sense that a browser is software. The question is whether there is a human intent behind the request and whether that intent is commercially legitimate. HUMAN Security frames this as a trust layer for the agentic era, DataDome calls it agent trust management, and Cloudflare’s three way split between search, agent and training is the same instinct expressed as taxonomy. The vocabulary will settle. The direction will not change.
Which means the measurement question changes shape too. Today you are asking: how much of my traffic is fake? Within two years the more important question will be: how much of my demand arrives through an intermediary I cannot instrument, and what is it worth? That is a harder question and the tooling for it barely exists. The teams that will answer it well in 2028 are the teams collecting the raw signals in 2026.
And a caution about the arms race. Everything in the detection half of this article will degrade. Transport fingerprinting works today because most automation does not bother to disguise it. Behavioural analysis works today because most automation simulates behaviour badly. Both statements have a shelf life. The layers that do not degrade are the structural ones: cryptographic verification at the bottom of the ladder, outcome truth at the top. Invest disproportionately in the two ends, because the middle is rented.
Objections, Trade Offs and Honest Limits
An article that only presents the case for its own thesis is advocacy. Here are the strongest arguments against everything above, and what we actually think about them.
“This is over engineering. Our numbers are fine.”
They might be. Some sites genuinely sit at 90 percent human traffic and have nothing meaningful to gain. The problem is that you cannot know which category you are in without measuring, and the measurement is cheap. Week one of the plan above costs a few hours with your own log files. Do that much before deciding the rest is unnecessary. If the answer comes back clean, you have bought certainty for the price of an afternoon.
“Blocking bots will hurt our search visibility.”
It will, if you do it carelessly, which is exactly why we have separated measurement from blocking throughout. Excluding Googlebot from your session counts has zero effect on your rankings. Blocking Googlebot at the edge is self harm. These are different actions and conflating them is the most common expensive mistake in this area. Note also that publishers already block other AI crawlers at nearly seven times the rate they block Googlebot, which suggests the industry has internalised the distinction between the crawler that pays in clicks and the one that does not.
“Verification will block real customers.”
This is the objection that deserves the most respect, because false positives have a real and asymmetric cost. A blocked bot costs you nothing. A blocked customer costs you a customer and possibly a complaint. Our position: never block on a single layer, never block on client side fingerprinting alone, and always instrument your false positive rate rather than assuming it. In practice, measurement only deployments have no false positive cost at all, which is another argument for starting there.
“The vendors cannot even get this right, so why bother?”
The Adalytics episode and the AI slop findings are real and we included them deliberately. But the conclusion is not that verification is futile. It is that verification you cannot audit is futile. The response to opaque systems failing is transparent systems, not resignation. Insist on decision rates, signal decomposition and reprocessability, from every vendor including us.
“Privacy regulation makes this harder than you are admitting.”
Fair. Behavioural and fingerprinting signals sit in a genuinely contested area under several regulatory regimes, and the analysis varies by jurisdiction and by purpose. Two things make this tractable. First, the security and fraud prevention purpose is generally on stronger footing than the marketing analytics purpose, so how you frame and document the processing matters. Second, and more usefully, most of the value in this article comes from signals that carry no personal data at all: autonomous system numbers, transport fingerprints, header ordering, request patterns and aggregate outcome rates. If you are prepared to accept slightly lower precision, you can build a very good verification system that never touches an individual’s characteristics. We are not lawyers, this is not legal advice, and your counsel should review any implementation.
“Our advertising platforms already filter invalid traffic.”
They do filter, and they issue credits. Two limits apply. Their filtering serves their definition of invalid, which is calibrated to their billing obligations rather than to your measurement needs. And their filtering happens inside their system, so you inherit a conclusion rather than evidence. Use their credits, and verify independently anyway.
“We do not have the engineering resources.”
The honest version of this constraint is usually about attention rather than headcount. Week one requires no engineering at all. Gating your conversion transmission to verified events is typically a small change in a tag manager. If those two things are all you ever do, you will have captured a large share of the available value.
“Will this hurt performance?”
Edge and origin log analysis is entirely out of band and costs nothing at request time. Transport fingerprinting is computed from data the connection already produced. A well built client beacon should add single digit kilobytes. The stage that can hurt is a synchronous verification call in the critical path, so do not build one. Verify asynchronously and score after the fact for everything except the highest value conversion actions.
And the limit we hold most firmly. No verification system reaches certainty. Ours does not, and neither does anyone else’s. What a good system produces is a well calibrated probability, an auditable trail of the evidence behind it, and a measured record of how often it was right. Anyone offering certainty in this category is describing a marketing position, not a measurement.
The Five Mistakes We See Most Often
Compressed, because pattern recognition is more useful than prose here.
Filtering instead of classifying. Deleted traffic cannot be analysed, audited or reprocessed. Keep everything with a label. The excluded population is often the most interesting dataset you own.
Cleaning reports but not conversion feeds. The most expensive version of a half finished implementation. Your dashboard becomes accurate while your bidding algorithms keep training on fraud. If you must choose one, clean the feed first.
Trusting a single signal. Address reputation alone, user agent alone, or one fingerprint alone. Every one of these has a defeat that costs an attacker minutes. Confidence comes from agreement, not from any individual check.
Treating this as a project. Detection rules decay. Adversaries adapt. Traffic mix shifts. A quarterly review and a weekly diagnostic are the minimum viable ongoing commitment, and a system nobody has looked at in six months is producing numbers nobody should trust.
Shipping the change without the narrative. Reported performance will decline the day you switch verification on. If leadership encounters that decline in a dashboard before they encounter the explanation from you, you will spend the following month defending the work instead of building on it. Brief first. Ship second.
The Costs That Never Appear on the Media Invoice
Wasted advertising spend is the cost everyone counts because it arrives as a number on a statement. It is rarely the largest cost. Here are the ones that hide in other budgets, and roughly how to size them.
Infrastructure. Every automated request consumes origin compute, database queries, bandwidth and cache capacity. When more than half of your requests are machines, more than half of your hosting bill is serving machines. Cloudflare’s finding that more than half of all AI crawl traffic was re fetching pages that had not changed since the last visit makes the waste concrete: you are paying to serve identical bytes repeatedly to clients that will not send anyone back. Size it by taking your monthly infrastructure cost and multiplying by your non human request share. The number is usually large enough to fund the entire verification programme on its own, which makes it a useful opening argument with an engineering budget holder.
Sales and support time. Every unreachable lead consumes research time, call attempts, sequence enrolment and a slot in someone’s daily queue. At a modest fifteen minutes per lead across attempts, a company generating 2,000 leads a month at a 25 percent contamination rate is burning roughly 125 hours of sales development capacity monthly on records that were never people. That is close to a full time salary spent dialling nobody.
Deliverability. Fake leads carry fake or recycled addresses. Sending to them raises bounce rates and spam complaints, which degrades your sending reputation, which reduces inbox placement for the real prospects on the same domain. This cost is invisible until it is severe, and it is genuinely difficult to reverse.
Forecast accuracy. Pipeline built on contaminated lead counts produces conversion assumptions that will not hold. Boards make hiring and inventory decisions on those assumptions. A forecast that is systematically optimistic by 20 percent at the top of funnel eventually becomes a hiring plan nobody can support.
Experimentation velocity. This one is subtle and expensive. Split tests need statistical power, and power depends on signal to noise. Adding a population that responds to nothing raises the noise floor and inflates the sample size required to detect a real effect. A team running tests against 25 percent inert traffic will need materially longer runtimes for the same confidence, which means fewer tests per quarter and slower learning. Traffic pollution does not just corrupt your answers, it slows down your ability to ask questions.
Model quality. Any propensity model, lookalike audience, lifetime value projection or churn predictor trained on contaminated data inherits the contamination. Unlike a dashboard, a model cannot be corrected retrospectively by a filter. It has to be retrained, and the training set has to be cleaned first.
Security surface. Scraping, credential stuffing and inventory abuse are measurement problems and risk problems at once. The median share of traffic attempting a scraping attack is approaching 20 percent globally and has nearly doubled since 2022, and the same classification work that cleans your reports gives your security team visibility it probably lacks.
Add those together and the media waste is often the smallest line. This matters strategically, because it changes who should sponsor the work. A traffic verification programme funded purely from the marketing budget is a marketing initiative. Funded jointly by marketing, engineering and revenue operations, it is an infrastructure decision, and it survives budget season.
Sector Notes: Where the Problem Looks Different
The general framework holds everywhere. The emphasis changes considerably by business model, and applying an e commerce playbook to a B2B pipeline wastes months. Here is what we would prioritise in each.
E commerce and retail. Your dominant pollution is price and inventory scraping, and it arrives constantly rather than in bursts. Competitors, aggregators, comparison engines and resellers all want your catalogue. Layered on top is the fastest growing agentic traffic in any sector, since retail plus streaming plus travel accounted for more than 95 percent of AI driven traffic in 2025. Priorities: separate scraping from agent traffic in classification, build an agent influenced revenue metric early, capture order events through webhooks independently of web analytics, and treat structured product data completeness as a distribution investment rather than a technical chore.
B2B software. Your volumes are small, which means contamination hits harder per unit. Your dominant pollution is form spam and fake trial signups, because your cost per click is high and your conversion action is cheap to fake. Priorities: gate conversion transmission to verified events before anything else, verify the contact channel asynchronously, add one qualifying field that automation answers badly, and align marketing and sales on a verified lead count. This sector has the highest ratio of benefit to implementation effort of any on this list.
Publishing and media. Your problem is inverted. You are not trying to keep bots out, you are trying to understand what they take and what they return. Crawl to refer ratios are your central metric, not a curiosity. With crawler access moving toward priced arrangements, the ability to attribute load by operator, purpose and outcome becomes a commercial capability rather than a reporting nicety. Priorities: verified operator identity in your logs, ratios computed monthly per operator with the window stamped, and a policy set by intent rather than by company name.
Travel, ticketing and hospitality. You have the worst raw numbers of any sector and you should calibrate expectations accordingly. Imperva found that bad bots made up 48 percent of all traffic to travel sites, with humans at 47 percent, which means humans are a minority of your audience before you start. Priorities: never benchmark against cross industry averages, watch search and availability endpoints separately from content pages since that is where the scraping concentrates, and expect your human traffic ratio to sit far below the ranges quoted earlier without that indicating a problem.
Marketplaces and classifieds. You face scraping on both sides of the market plus fake account creation plus review manipulation. Your listing pages are the target and your signup flow is the second target. Priorities: authenticated session analysis separate from anonymous browsing, account creation verification with outcome feedback, and careful attention to the fact that some scraping is from partners you have agreements with and should be classified as such rather than treated as abuse.
Local and service businesses. Small absolute volumes make single incidents dominant. One competitor exhausting a budget or one form farming operation can consume an entire month’s marketing spend. Priorities: the cheapest possible version of everything. Log review, form protection, verified conversion transmission. You do not need a truth layer architecture. You need three controls and someone looking at the numbers once a week.
Financial services. Your pollution skews adversarial rather than extractive. Financial services was the most targeted industry for account takeover, accounting for 22 percent of all incidents. Your measurement problem and your security problem are the same problem with two owners, and the single highest value organisational move is making them share one classification rather than maintaining two.
The common thread across all seven: the general question is always what fraction of this is real, and the specific answer always depends on what somebody wants from you. Work out what an adversary or an aggregator gains from your site, and you will predict the shape of your pollution before you measure it.
The Direct Traffic Problem and the Zero Click Web
There is one segment in every analytics account that deserves separate treatment, because it has quietly become the place where three completely different populations pile up on top of each other.
Direct traffic is defined by absence. It is what your analytics calls a visit when no referrer arrived and no campaign parameters were present. That definition made sense when the only way to produce it was typing a URL into a browser. It makes very little sense now.
Today, the direct bucket contains at least four distinct populations.
Genuine direct visitors. People who know your brand and came back deliberately. This is the population everyone imagines when they see the segment growing, and it is the reason a rising direct line so often gets reported upward as evidence of brand strength.
Stripped referrers. Visits from messaging apps, native mobile applications, email clients, documents, and any context where the referrer never survives the hop. Cloudflare noted this explicitly when publishing crawl to refer ratios, observing that traffic referred by native applications does not include a referrer header and that the same is likely true of other native apps.
Undeclared automation. Scripts that send no referrer because they have no reason to invent one. Direct is the default landing place for anything that requests a page without pretending to have come from somewhere.
Agent mediated arrivals. A person asked an assistant, the assistant did the comparison work, and the resulting visit arrives naked. No source, no medium, no campaign, and a session that begins at the decision point rather than the discovery point.
Those four populations have opposite implications. The first is your most valuable audience. The third is pollution. The second and fourth are real demand whose origin you have lost. Reporting them as one number and calling it brand strength is the most common self deception in modern analytics.
The structural driver behind the second and fourth categories is the shift toward answers that never require a click at all. Pew Research Center tracked the real browsing behaviour of 900 United States adults across 68,879 Google searches during March 2025 and found that when an artificial intelligence summary appeared, users clicked a traditional search result in just 8 percent of visits, against 15 percent of visits without one. Clicks on the links cited inside the summaries were rarer still, at 1 percent. Users were also more likely to end their browsing session entirely after encountering a summary, at 26 percent against 16 percent.
Read that alongside the crawl to refer data and a coherent picture emerges. Content is being consumed at increasing volume and referred at decreasing volume. Your server sees the consumption. Your analytics sees only the shrinking referral. The gap between those two things is not a tracking bug, it is the actual state of the web, and no amount of tag configuration will close it.
So what do you do with the direct segment?
Split it by verification status first. Verified human direct and unverified direct are two different metrics and should never share a row.
Then split verified human direct by session shape. Sessions that begin on your homepage and browse look like returning brand visitors. Sessions that begin deep on a product or pricing page with high intent and no history look like agent mediated or referrer stripped arrivals. Those are different stories and they justify different investments.
Instrument what you can still see. Branded search volume, direct navigation to your homepage, assisted conversions, and the raw consumption visible in your logs are all partial proxies for demand you can no longer attribute. None is complete. Together they are considerably better than treating the whole segment as one lump.
And accept the irreducible part. Some share of your demand now originates in a context with no instrumentation and never will have any. The right response is to lean harder on the experimental methods described earlier, because a geographic holdout does not care whether a referrer survived.
A Worked Example: Diagnosing a Suspicious Spike
Theory is easier to remember when attached to a procedure. Here is the sequence we run when a traffic anomaly appears, in the order we run it, with the reasoning for each step.
Step one: establish whether the spike exists in the logs.
Compare edge or origin request counts against analytics sessions for the affected window. If analytics moved and logs did not, you are looking at a tagging change, a measurement protocol injection, or a filter change, not a traffic event. This single check resolves a surprising share of incidents in about four minutes and it costs nothing.
Step two: group by autonomous system, descending.
Concentration is diagnostic. Genuine human demand arrives distributed across consumer broadband and mobile networks. If the increase resolves to a handful of networks, particularly hosting providers, you have your answer already. If it is distributed across hundreds of consumer networks, you are either looking at real demand or at a residential proxy operation, and you need the next step to tell them apart.
Step three: check transport fingerprint consistency.
Take the incremental population and compare the declared user agent against the TLS and HTTP/2 fingerprints. Real Chrome produces a Chrome handshake. A high rate of mismatch across a population claiming to be current browsers is close to conclusive, and it is the check that separates a residential proxy operation from genuine distributed demand.
Step four: look at the shape of the sessions.
Request paths, ordering, timing between requests, whether assets were fetched, whether JavaScript executed. Automation usually reveals itself in structure: identical path sequences, perfectly regular intervals, missing asset requests, or a request for a page with no request for the resources that page needs.
Step five: check the conversion points.
Did the incremental traffic touch your forms, your cart or your login? If yes, this is a revenue and data integrity incident, not a load incident, and it escalates. If no, it is bandwidth and reporting noise, which is annoying but not urgent.
Step six: pull the outcomes.
If leads or orders were created, resolve them. Contact attempts, email validity, payment authorisation results, chargeback flags. Outcome truth settles arguments that fingerprints only inform.
Step seven: decide separately about measurement and blocking.
Exclude the population from reporting immediately, because that is reversible, low risk and improves accuracy today. Decide about blocking on the evidence, in a different conversation, with different people in the room. Conflating these two decisions under time pressure is how sites accidentally block a search engine during a traffic scare.
Step eight: write it down.
Date, window, population size, signals that identified it, action taken, outcome. Six months from now the pattern will recur in a slightly different form and the note will save you the whole investigation. Institutional memory is a competitive advantage in a discipline where the adversary iterates continuously.
Frequently Asked Questions
How much of my web traffic is probably bots?
Across the whole internet, the 2026 Bad Bot Report from Thales and Imperva puts automated traffic at more than 53 percent of all web traffic in 2025, split into 40 percent bad bots and 13 percent good bots, with humans at 47 percent. Your own site will differ substantially. Travel, ticketing, marketplaces and any site with public pricing typically run far higher. Established brands with heavy branded search and email traffic typically run lower. The only figure that matters for your decisions is your own, computed from your own logs.
Does Google Analytics 4 remove bot traffic?
Partially. Google states that traffic from known bots and spiders is automatically excluded using Google research plus the International Spiders and Bots List maintained by the Interactive Advertising Bureau, and that you cannot disable this exclusion or see how much was excluded. That covers declared, list based automation. It does not cover headless browsers presenting normal user agents, scraping through residential proxies, click fraud automation, or fabricated events sent directly through the Measurement Protocol. Treat the bot share visible in GA4 as a structural undercount.
What is the difference between GIVT and SIVT?
They are the Media Rating Council’s two tiers of invalid traffic. General Invalid Traffic is identified through routine, list based filtration: declared bots and crawlers, non browser user agents, prefetch and prerender traffic. Sophisticated Invalid Traffic requires advanced analytics and multipoint corroboration: hijacked devices, malware driven traffic, human mimicking automation, residential proxy networks and autonomous agents. Most inexpensive filtering only handles the first tier. Accreditation for the second includes the first, but not the reverse.
Should I block AI crawlers?
Not as a single decision. There are at least four distinct AI traffic types with different economics: training crawlers that build model corpora and send nothing back, search and indexing crawlers that can produce citations, retrieval fetchers that pull a page because a live user asked a question, and agentic browsers acting for a named person who may buy something. Blocking all four with one directive collapses four business questions into one answer. Compute a crawl to refer ratio per operator per month and decide on evidence.
What is a crawl to refer ratio?
The number of pages a platform’s crawlers fetch from your site divided by the number of referral visits that platform sends back. Cloudflare publishes these on Radar and the spread across operators runs from low single digits for traditional search to five figures for some AI platforms. Two rules: ratios are specific to the measurement window and must never be averaged across windows, and native application referrals often arrive without a referrer header, which can overstate the imbalance. Read them as orders of magnitude, and compute your own.
Why did my conversion rate stay flat while my cost per acquisition rose?
This is the classic signature of traffic pollution. Pollution inflates the numerator and the denominator of a ratio metric roughly together, so conversion rate can look stable while everything under it degrades. Cost metrics have real currency over a possibly fake count, so they absorb the full error. If cost per acquisition is drifting up while conversion rate holds, look at traffic composition before you look at your landing page.
Are fake leads really that common?
Bot submission rates on unprotected forms are commonly reported between 15 and 40 percent, with some high value verticals such as insurance and mortgage exceeding 50 percent, and roughly three quarters of marketers report unreliable lead data quality. The volume varies enormously with how much your click is worth. High cost per click categories attract more of it, because the economics of manufacturing a fake lead improve as the value of a real one rises.
What is the single highest value change I can make?
Stop transmitting unverified conversions to your advertising platforms. Automated bidding builds its model of a valuable user from the conversion events you send back, so every fake conversion is an instruction to find more traffic like it. Gating that feed to verified events is usually a small change in a tag manager or server container and it stops the compounding damage immediately.
Will verification hurt my search rankings?
Not if you separate measurement from blocking, which you should. Excluding Googlebot from your session counts has no effect whatsoever on rankings. Blocking Googlebot at the edge is self harm. These are different actions taken in different systems and conflating them is the most common expensive mistake in this area.
How do I prove my clean numbers are correct?
Experimentally, not through more detection. Run a geographic holdout: suppress a channel in matched control markets and measure the difference in total business outcomes rather than tracked conversions. This method establishes causality structurally and is immune to every tracking problem discussed here. The eBay field experiments published in Econometrica remain the clearest demonstration, showing that returns from paid search were a fraction of non experimental estimates and that brand keyword advertising had no measurable short term benefit at all.
Is address blocking still useful?
As context, yes. As evidence, no longer. Residential proxy networks route traffic through consumer devices, so origin and presented geography are decoupled. Observed botnet populations approach 60 million victim addresses, and the majority of malicious residential addresses rotate out of the pool within a month. Use network data to inform a confidence score. Never use it alone to reach a verdict.
What about the traffic my analytics never sees at all?
That is the more important half of the problem and it is growing. Fetchers, agents, native application referrals and zero click answers all consume your content without producing an instrumented session. Pew Research found that when an AI summary appeared, users clicked a traditional result in 8 percent of visits against 15 percent without one, and clicked a source link inside the summary just 1 percent of the time. Your logs see this consumption. Your analytics does not. Capture the raw signals now, because you cannot backfill an event you never recorded.
Does any of this apply to a small site?
Yes, and often more acutely, because small denominators are more sensitive to contamination. A site with 4,000 monthly sessions and 25 percent pollution is making decisions on 3,000 real sessions while believing it has 4,000, and a handful of fake leads can dominate a month’s reporting. The good news is that the diagnostic work scales down cleanly. A week of log analysis costs the same few hours whatever your traffic volume.
How often should I revisit this?
Weekly for the diagnostics: human traffic ratio by channel, discrepancy rate and verification coverage. Monthly for crawl to refer ratios and clean cost metrics. Quarterly for rescoring a historical period with current rules to check for drift and re running your outcome validation. Detection rules decay continuously because the adversary iterates continuously.
Does ClickBaton block traffic or just measure it?
Both, but deliberately as separate decisions. The same classification pipeline can drive edge enforcement if you want it to, and plenty of teams use the measurement output only. We think that separation matters: most non human traffic should be measured and excluded from reporting while remaining perfectly welcome to fetch the page.
What should I do about traffic that arrives with no referrer at all?
Split it before you interpret it. Direct traffic now contains at least four populations: genuine returning visitors, referrer stripped arrivals from apps and messaging clients, undeclared automation, and agent mediated visits that begin at the decision point. Verification status separates the third from the rest. Session shape separates the first from the second and fourth: homepage entry with browsing behaviour looks like brand demand, while deep entry on a pricing or product page with high intent and no history looks like an intermediated arrival.
Is server side tracking a solution to this?
It is a collection improvement, not a verification method. Moving collection to your own domain gives you request headers, transport metadata and resilience against content blockers, all of which make verification possible. It does not classify anything by itself. A server side setup with no classification layer produces the same polluted numbers, delivered more reliably. Treat it as the foundation you build on rather than the fix.
What is the minimum viable version of all this?
Three things. Pull a month of your own request logs and group them by network to size the problem. Gate the conversion events you send to advertising platforms so only verified events are transmitted. Add invisible form protection with asynchronous contact verification. Those three actions require no new vendor, capture a large share of the available value, and can be completed by a small team inside two weeks.
The Closing Argument
Every discipline has a moment where its foundational assumption quietly stops being true, and the practitioners who notice first spend a few uncomfortable years being told they are overthinking it.
Digital marketing was built on a beautiful premise: that everything is measurable. Not measurable in the fuzzy way that television and print were measurable, but measurable exactly, event by event, person by person. That premise justified two decades of budget migration, an entire software industry, and the professional identity of a generation of marketers who could finally answer the question their predecessors could not.
The premise was always slightly overstated. It is now substantially wrong, and it is wrong in a specific and fixable way. We can still measure events with extraordinary precision. What we can no longer do is assume that an event implies a person.
That is the whole thing. Every technique in this article, from forward confirmed reverse DNS to transport fingerprinting to geographic holdout testing, exists to reconstruct a link between an event and a human that used to be free and is now expensive.
The teams that will win the next few years are not the ones with the best detection technology. Detection decays, adversaries adapt, and the middle rungs of the ladder are rented rather than owned. The teams that will win are the ones that changed what they consider a number.
They report verified human sessions instead of sessions. They transmit verified conversions instead of conversions. They know their human traffic ratio by channel and watch its derivative rather than its level. They can decompose any score into the signals behind it and replay any decision they made six months ago. They calibrate against experiments rather than asserting from dashboards. And they write down what they do not know.
None of that is exotic. Most of it is a fortnight of work and a decision to stop treating a request as a proxy for a person.
The web is now a majority machine environment and it is not going back. You can measure that world honestly or you can keep reporting a number that describes a web that ended in 2024. The first option produces smaller figures and better decisions. In our experience, everyone who has made the trade says the same thing afterward: the hard part was not the technology, it was the first Monday morning when the sessions chart went down 26 percent and somebody had to stand up and explain that this was the good news.
If you want to see what your own traffic actually looks like underneath the reporting, that is precisely what we built ClickBaton to show you. And if you build it yourself instead, we will consider this article to have done its job.
References
Bot and automated traffic research
- Thales and Imperva. 2026 Bad Bot Report. Imperva Resource Library.
- Imperva. Bad Bot Report 2026: Bots in the Agentic Age. Imperva Blog.
- Thales. 2025 Imperva Bad Bot Report: AI Driven Bots Surpass Human Traffic. Thales Newsroom.
- Imperva. 2025 Imperva Bad Bot Report: How AI is Supercharging the Bot Threat. Imperva Blog.
- Imperva. The Rapid Rise of Bots and the Unseen Risk for Business. Full report, PDF.
- Business Wire. Artificial Intelligence Fuels Rise of Hard to Detect Bots. Press release.
- HUMAN Security. The 2026 State of AI Traffic and Cyberthreat Benchmark Report.
- HUMAN Security. Measuring the AI Driven Internet. HUMAN Blog.
- GlobeNewswire. HUMAN Security 2026 State of AI Traffic Report: Automation Growth Now Outpaces Humans.
- Fastly. AI Crawlers Make Up Almost 80% of AI Bot Traffic. Fastly Q2 2025 Threat Insights Report.
Cloudflare network measurement
- Cloudflare. The 2025 Cloudflare Radar Year in Review. Cloudflare Blog.
- Cloudflare. Cloudflare Radar 2025 Year in Review, interactive.
- Cloudflare. The Crawl Before the Fall of Referrals: Understanding AI’s Impact on Content Providers. Cloudflare Blog.
- Cloudflare. Message Signatures Are Now Part of Our Verified Bots Program. Cloudflare Blog.
- Search Engine Journal. Cloudflare Report: Googlebot Tops AI Crawler Traffic.
- The Register. Bot Invasion Increases With Google Scraping the Way, Cloudflare Says.
- TechRadar Pro. Cloudflare Report Reveals Global Internet Traffic Grew 19 Percent in 2025.
- InfoQ. Cloudflare Year in Review: AI Bots Crawl Aggressively.
AI agents and agentic traffic
- DataDome. The AI Traffic Report Q2 2026: Agentic Traffic Surged 45 Percent.
- DataDome. The AI Traffic Report: High Volume, Low Visibility and a Growing Risk.
- DataDome. Most Organizations Flying Blind as Agentic Traffic Surges. Press release.
- Digiday. AI Visibility Is No Longer About Referral Traffic.
- commercetools. Agentic Commerce Stats 2026: Enterprise Guide.
- Opascope. AI Shopping Assistant Guide 2026: Agentic Commerce Protocols.
- AWS. AWS WAF Announces Web Bot Auth Support.
- TechCrunch. Cloudflare’s New Policy Pushes AI Companies to Pay for Publishers’ Content.
- MLQ News. Cloudflare Sets September 15 Deadline for AI Companies to Separate Training Crawlers.
Invalid traffic and ad fraud measurement
- Media Rating Council. Invalid Traffic Detection and Filtration Standards Addendum. PDF.
- Interactive Advertising Bureau. MRC Invalid Traffic Detection and Filtration Guidelines Addendum.
- Media Rating Council. MRC Issues Final Version of Invalid Traffic Detection and Filtration Guidelines Addendum.
- Pixalate. MRC Definitions for Invalid Traffic: SIVT.
- Pixalate. Q1 2026 Ad Fraud Benchmarks Report.
- Fraudlogix. Ad Fraud Statistics 2026: 20.64 Percent Invalid Traffic Rate.
- Fraudlogix. Ad Fraud Statistics Q1 2026.
- Juniper Research. Quantifying the Cost of Ad Fraud, 2023 to 2028. PDF.
- Juniper Research. Digital Advertising Spend Lost to Fraud to Reach $68bn.
Programmatic transparency and supply quality
- Association of National Advertisers. Q2 2025 Programmatic Transparency Benchmark.
- Association of National Advertisers. Programmatic Media Supply Chain Transparency Study, First Look.
- Marketing Dive. ANA: 15 Percent of Programmatic Ad Spend Is Wasted on Click Bait Websites.
- Marketing Dive. Just 36 Percent of Programmatic Spend Reaches Consumers Due to Cost Waterfall.
- Trustworthy Accountability Group, ANA and Fiducia. Analysis Quantifies Level of AI Slop in the Digital Advertising Supply Chain.
- AdExchanger. Adalytics: The Ad Industry’s Bot Problem Is Worse Than We Thought.
- DoubleVerify. DoubleVerify’s Response to the Adalytics March 28 GIVT Report.
- MediaPost. DoubleVerify Can Proceed With Suit Against Adalytics, Judge Rules.
Analytics platform documentation
- Google. Known Bot Traffic Exclusion. Google Analytics Help.
- Opticks Security. Bot Traffic in Google Analytics: What GA4 Does Not Tell You.
Residential proxies and evasion infrastructure
- Lumen Black Lotus Labs. Symbiotic Parasites: The Modern Proxy Ecosystem.
- Bitsight. Residential Proxy Services and Malware Ecosystems.
- Nokia. One Year Later: The Residential Proxy Botnet Problem Got Bigger, Not Smaller.
- SC Media. Botnets Powered by Residential Proxy Networks Are Growing.
- Help Net Security. Residential Proxies Make a Mockery of Address Based Defenses.
Search behaviour, causality and measurement method
- Pew Research Center. Google Users Are Less Likely to Click on Links When an AI Summary Appears in the Results.
- Blake, T., Nosko, C. and Tadelis, S. Consumer Heterogeneity and Paid Search Effectiveness: A Large Scale Field Experiment. Econometrica, volume 83, issue 1, 2015.
- Blake, T., Nosko, C. and Tadelis, S. Working paper version. National Bureau of Economic Research, Working Paper 20171.
- Measured. Marketing Mix Modeling: A Complete Guide for Strategic Marketers.
- Lifesight. Geo Based Incrementality Testing: Marketer’s Guide 2026.
Lead quality and conversion benchmarks
- LeadGen Economy. Bot Detection and CAPTCHA for Lead Forms: A Complete Implementation Guide.
- LeadGen Economy. Human Fraud Farms and the Detection Stack That Bot Tools Cannot Replace.
- G2. How to Fix Lead Data Quality at the Form Before It Breaks Your Funnel.
- Propel Commerce. Average Ecommerce Conversion Rate 2026: The Actual Numbers by Industry.
Last reviewed August 2026. Figures reflect the most recent published editions of each source at that date. Where a source reports a value tied to a specific measurement window, the window is stated in the text, and readers should check the original for updates before citing.

I manage ClickBaton.com and ROIpad.com our product positioning intelligence platform. I am always open to new partnerships, collaboration and speaking directly with founders who are looking to test our products. Please feel free to connect with me on linkedin.